Sign in
Please select an account to continue using cracku.in
↓ →
Join Our JEE Preparation Group
Prep with like-minded aspirants; Get access to free daily tests and study material.
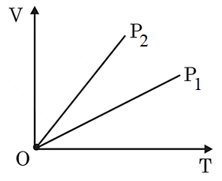
The given figure represents two isobaric processes for the same mass of an ideal gas, then
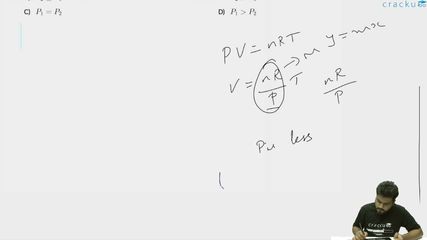
For an ideal gas,
$$PV=nRT$$
For an isobaric process (P= constant),
$$V=\frac{nR}{P}T$$
This is a straight line on a V-T graph, with slope
$$slope=\frac{nR}{P}$$
Since same mass of gas is used, n is constant, so slope is inversely proportional to pressure:
$$\text{slope}\propto\frac{1}{P}$$
Line $$P_2$$ is steeper than line $$P_1$$, so
$$\frac{nR}{P_2}>\frac{nR}{P_1}$$
which gives
$$P_1>P_2$$
Click on the Email ☝️ to Watch the Video Solution
Create a FREE account and get:


Educational materials for JEE preparation

Ask our AI anything

AI can make mistakes. Please verify important information.
AI can make mistakes. Please verify important information.
