Select the most appropriate meaning of the given idiom.
Reinventing the wheel
SSC CHSL 19th March 2020 Shift-2
For the following questions answer them individually
Select the correct indirect form of the given sentence.
Nakul asked her, "How do you knowthat Rahulhastold it to him?"
Select the most appropriate ANTONYM of the given word.
TAME
Select the most appropriate synonym of the given word.
TARNISH
In the following passage some wordshave been deleted. Fill in the blanks with the help of
the alternatives given. Select the most appropriate option for each blank.
Forest fire always (1)_____ by one of two reasons-naturally caused or human-caused. Natural fire is generally (2)_____ by lightning, with a very small percentage (3)_____ by spontaneous combustion of dry fuel such as saw dust and leaves.(4)_____, human-caused fire can happen (5)_____ any numberof reasons.
Select the most appropriate option for blank No.1.
Select the most appropriate option for blank No.2.
Select the most appropriate option for blank No.3.
Select the most appropriate option for blank No.4.
Select the most appropriate option for blank No. 5.
For the following questions answer them individually
In the sentence identify the segment which contains the grammatical error.
Cats cannot be blamed for its behaviour to their masters as they are tamed so.
Select the correct passive form of the given sentence.
This android can perform all the programmes perfectly well.
Given below are four jumbled sentences. Out of the given options pick the one that gives their correct order.
A. He wason a pilgrimage to Jerusalem.
B. The villagers were kind though doubtful.
C. They offered him some food to eat and a room to stay.
D. One night, he tookrest in a village unfamiliar on the way.
Select the most appropriate option to substitute the underlined segmentin the given sentence.If there is no need to substitute it, select "No improvement".
She is tender-hearted by nature and | have found her eyes moist many a times over the sad face of any children.
Select the wrongly spelt word.
In the sentence identify the segment which contains the grammatical error.
Some of the issues discussed on the media now a days has no relevance to the nation-building process
Select the word which meansthe sameas the group of words given.
A personliving in the same age with another
Select the most appropriate synonym of the given word.
PLEASANT
Select the most appropriate option to substitute the underlined segmentin the given
sentence.If there is no need to substitute it, select †"No improvement".
The selection to the police department raised him as high to a kite.
Select the most appropriate meaning of the given idiom.
Falling head over heels
Select the most appropriate ANTONYM of the given word.
DISPUTE
Select the word which meas the same as the group of words given.
A situation requiring a choice between equally undesirable alternatives or confusions
Select the most appropriate word to fill in the blank.
Children need special care and _____ from the side of their parents for making them emotionally strong.
Given below are four jumbled sentences. Out of the given options pick the onethat givestheir correct order.
A. The driver had a cloudy look and drove off without taking him.
B. He asked a taxi driver to take him to the shopping mall.
C. He told the driver that he could pay the fare by card, not in cash.
D. He arrived on the outskirts ofa city.
Select the wrongly spelt word.
Select the most appropriate word to fill in the blank.
Unnecessary suspicion and lack of trust against the others are caused by _____.
Three of the following four words are alike in a certain way and one is different. Select the odd one.
Solution
Login to view the detailed solution.
Select the figure that will come next in the following figure series.

Solution
Login to view the detailed solution.
Two different positions of the same dice are shown below, the six faces of which are numbered 1 to 6. Which number is on the face opposite the face showing 1?

Solution
Login to view the detailed solution.
Select the correct mirror image of the given letter cluster when a vertical mirror is placed on the right of the cluster.

Solution
Login to view the detailed solution.
In a certain code language, 'STAFF' is written as 'RTSUZBEGEG'. How will 'ORDER' be written as in that language?
Solution
Login to view the detailed solution.
Select the option that is related to the third term in the same way as the second term is related to the first term.
Gloves : Hands : : Shoes : ?
Solution
Login to view the detailed solution.
Select the option in which the number set shares the same relationship as that shared by the given number set.
(11, 17, 204)
Solution
Login to view the detailed solution.
Select the number that can replace the question mark (?) in the following series.
50, 49, 53, 44, 60, 35, ?
Solution
Login to view the detailed solution.
How many triangles are there in the figure given below?

Solution
Login to view the detailed solution.
Select the combination of letters that when sequentially placed in the gaps of the given letter series will complete the series.
K _ _ MKXZ _ KX _ MK _ ZM
Solution
Login to view the detailed solution.
Select the option in which the number set shares the same relationship as that shared by the given number set.
(52, 48, 64)
Solution
Login to view the detailed solution.
Select the option that is related to the third letter cluster in the same way as the second letter cluster is related to the first letter cluster.
NR : MI :: BK : ?
Solution
Login to view the detailed solution.
Select the correct alternative to indicate the arrangement of the following words in a logical and meaningful order.
1, Mount Abu
2. World
3. India
4. Rajasthan
5. Nakki Lake
Solution
Login to view the detailed solution.
In a batch of 68 students, 23 students do not participate in any of the two games i.e. cricket and squash. 17 students participate in cricket only, 24 students participate in cricket and squash. How many students participate in squash only?
Solution
Login to view the detailed solution.
Select the option that is related to the third number in the same way as the second number is related to the first number.
3 : 67 :: 6 : ?
Solution
Login to view the detailed solution.
Which two signs and two numbers should be interchanged to make the given equation correct?
$$16 + 8 \times 25 - 15 \div 5 = 138$$
Solution
Login to view the detailed solution.
In a certain code language, 'WORKSHOP’ is written as '231518118191211'. How will 'NOVEMBER' be written as in that language?
Solution
Login to view the detailed solution.
Select the Venn diagram that best represents the relationship between the following classes.
Infants, Males, Fathers
Solution
Login to view the detailed solution.
Select the word-pair in which the two words are related in the same way as are the two words in the following word-pair.
Diabetes : Disease
Solution
Login to view the detailed solution.
Three of the following four letter-clusters are alike in a certain way and one is different. Select the odd one.
Solution
Login to view the detailed solution.
Read the given statements and conclusions carefully. Assuming that the information given in the statements is true, even if it appears to be at variance with commonly known facts, decide which of the given conclusions logically follow(s) from the statements.
Statements:
No plastic is iron.
All steel is iron.
Conclusions:
I. Some plastic is steel.
II. Some iron is steel.
III. No steel is plastic.
Solution
Login to view the detailed solution.
The sequence of folding a piece of paper and the manner in which the folded paper has been cut is shown in the following figures. How would this paper look when unfolded?

Solution
Login to view the detailed solution.
In a certain code, 'sky is blue’ is written as '815' ; 'blue and red' is written as '725'; 'Ram likes red’ is coded as '203'; 'Sita and Ram' is written as '379'. What will be the code for 'Ram likes blue’?
Solution
Login to view the detailed solution.
Select the option figure which contains figure X embedded in it as its part. (Rotation is not allowed)

Solution
Login to view the detailed solution.
Pointing to the photograph of Amit, Gagan said, 'His sister's mother's husband is my daughter's mother's husband's father.’ How is Amit related to Gagan?
Solution
Login to view the detailed solution.
The area of an isosceles right angled triangle is 121 cm$$^2$$. Find its hypotenuse.
Solution
Login to view the detailed solution.
The distance between the centres of two equal circles each of radius 4 cm is 17 cm. The length of a transverse tangent is:
Solution
Login to view the detailed solution.
A car covered 150 km in 5 hours. If it travels at one-third its usual speed, then how much more time will it take to cover the same distance?
Solution
Login to view the detailed solution.
The printed price on a book is ₹ 150. If it is sold after two successive discounts of 30% and 40%, then find its selling price.
Solution
Login to view the detailed solution.
The given bar graph shows the biscuit exports of India over a period of five years. Study the graph and answer the question that follow.
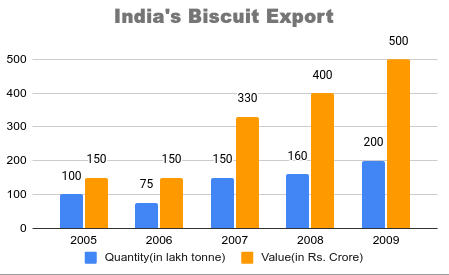
In which two years was the value per tonne equal?
Solution
Login to view the detailed solution.
If $$2\cot\theta=3$$, then $$\frac{\sqrt{13}\cos\theta-3\tan\theta}{3\tan\theta+\sqrt{13}\sin\theta}$$ is:
Solution
Login to view the detailed solution.
If $$x^4+\frac{1}{x^4}=14159$$, then the value of $$x+\frac{1}{x}$$ is:
Solution
Login to view the detailed solution.
The three medians AX, BY and CZ of $$\triangle$$ABC intersect at point L. If the area of $$\triangle$$ABC is 30 $$cm^2$$, then the area of the quadrilateral BXLZ is:
Solution
Login to view the detailed solution.
The given bar-graph represents the number of teachers in different weight groups. Study the graph and answer the question that follows.
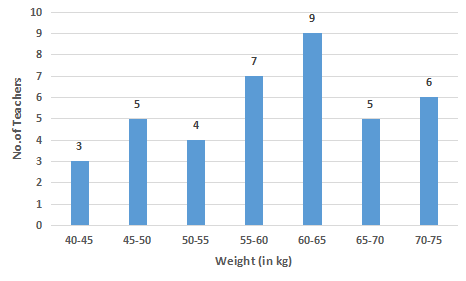
In which of the following weight groups is the number of teachers the maximum?
Solution
Login to view the detailed solution.
The given bar graph shows the biscuit exports of India over a period of five years. Study the graph and answer the question that follow.

In which year, the percentage increase in exports was maximum from its preceding year:
Solution
Login to view the detailed solution.
If X = $$\tan 40^\circ$$, then the value of $$2 \tan 50^\circ$$ will be:
Solution
Login to view the detailed solution.
In a question on division, the divisor is 6 times the quotient and 3 times the remainder. If the remainder is 40, then find the dividend.
Solution
Login to view the detailed solution.
Two circles of radii 20 cm and 5 cm, respectively, touch each other externally at the point P, AB is the direct common tangent of those two circles of centres R and S, respectively. The length of AB is equal to:
Solution
Login to view the detailed solution.
Kamal and Anil can dig a pond in 8 days and 14 days, respectively. If the total expense of digging is ₹ 4,400, then how much money will Anil earn?
Solution
Login to view the detailed solution.
IF L is the circumcentre of $$\triangle$$XYZ and angle X is $$40^\circ$$, then the value of $$\angle$$YZL is:
Solution
Login to view the detailed solution.
Simplify the expression $$25 - \left[16 - \left\{14 - \left(18 - \overline{8 + 3}\right) \right\}\right]$$.
Solution
Login to view the detailed solution.
If $$a-b=18$$ and $$a^3-b^3=324$$, then find ab.
Solution
Login to view the detailed solution.
The given bar graph shows the biscuit exports of India over a period of five years. Study the graph and answer the
question that follow.

What was the percentage drop in the export quantity from 2005 to 2006?
Solution
Login to view the detailed solution.
A man sold his bike for ₹ 25,000 at 25% profit. At what price would it he have sold if he had incurred a loss of 15%?
Solution
Login to view the detailed solution.
The average of 40 numbers is 36. The average of the first 25 numbers is 31 and the average of last 16 numbers is 43. Find the 25th number.
Solution
Login to view the detailed solution.
A woman earns ₹ 1,000/day. After some weeks, she earns ₹1,160/day. By how much percentage did her earnings
increase?
Solution
Login to view the detailed solution.
If $$2x=\sin\theta$$ and $$\frac{2}{x}=\cos\theta$$, then the value of $$4\left(x^2+\frac{1}{x^2}\right)$$ is:
Solution
Login to view the detailed solution.
The area of the quadrant of a circle whose circumference is 22 cm, will be:
Solution
Login to view the detailed solution.
How much will be decreased to each terms of ratio 16 : 19, so that it will be 7 : 6?
Solution
Login to view the detailed solution.
Suresh lent out a sum of money to Rakesh for 5 years at simple interest. At the end of 5 years, Rakesh paid 9/8 of the sum to Suresh to clear out the amount. Find the rate of simple interest per annum.
Solution
Login to view the detailed solution.
When was the Rovers Cup started?
Which film won the Golden Globe Awards 2020 for Best Picture - Drama?
Lavani is a folk music of which state?
Which of the following kingdoms consists of prokaryotic cells?
Who won the Sahitya Akademi Award 2019 in Hindi?
Which of the following is one of the sacred books of Buddhism?
The National Bank for Agriculture and Rural Development (NABARD) was established in:
Which function key is used for opening help?
How many people were awarded Padma Vibhushan in 2019?
Lipulekh Pass is in which state of India?
GST was introduced by which amendment act of the Constitution?
When was WhatsApp incorporated?
Who is/was the 13th President of India?
Salsette Island is situated in which state of India?
In Tibet, the Brahmaputra river is known as:
Which of the following countries was the runner up in the 2019 ICC Cricket World cup?
How many Lok Sabha constituencies are there in Rajasthan?
Where is the Dudhsagar waterfalls located?
What was the theme of the International Yoga Day 2019?
Shore temple is situated in which state of India?
Which state has launched the Cyber Safe Woman Campaign in January 2020?
What did Wilhelm Conrad Roentgen discover?
Vivekananda Rock Memorial is in which state of India?
What is the atomic weight of Lithium?
Jitu Rai is associated with which sport?

