Question 60
The given bar graph shows the biscuit exports of India over a period of five years. Study the graph and answer the question that follow.
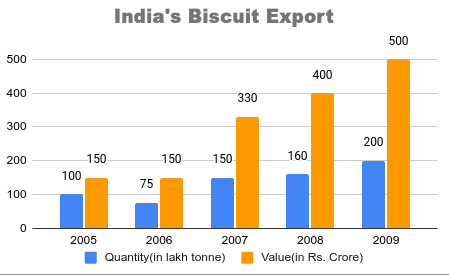
In which year, the percentage increase in exports was maximum from its preceding year:
Solution
From the bar graph,
Percentage increase in exports from 2006 to 2007 = $$\frac{150-75}{75}\times100=$$ 100%
Percentage increase in exports from 2007 to 2008 = $$\frac{160-150}{150}\times100=$$ 6.66%
Percentage increase in exports from 2008 to 2009 = $$\frac{200-160}{200}\times100=$$ 20%
From 2005 to 2006, there was decrease in exports.
$$\therefore\ $$The percentage increase in exports was maximum in 2007 from its preceding year.
Hence, the correct answer is Option A
Get AI Help
Create a FREE account and get:
- Free SSC Study Material - 18000 Questions
- 230+ SSC previous papers with solutions PDF
- 100+ SSC Online Tests for Free


