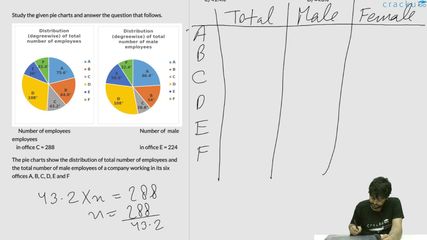
Study the given pie charts and answer the question that follows.

Number of employees Number of male employees
in office C = 288 in office E = 224
The pie charts show the distribution of total number of employees and the total number of male employees of a company working in its six offices A, B, C, D, E and F
The number of female employees as a percentage of male employees is second lowest
in office:
Solution
Using the table,
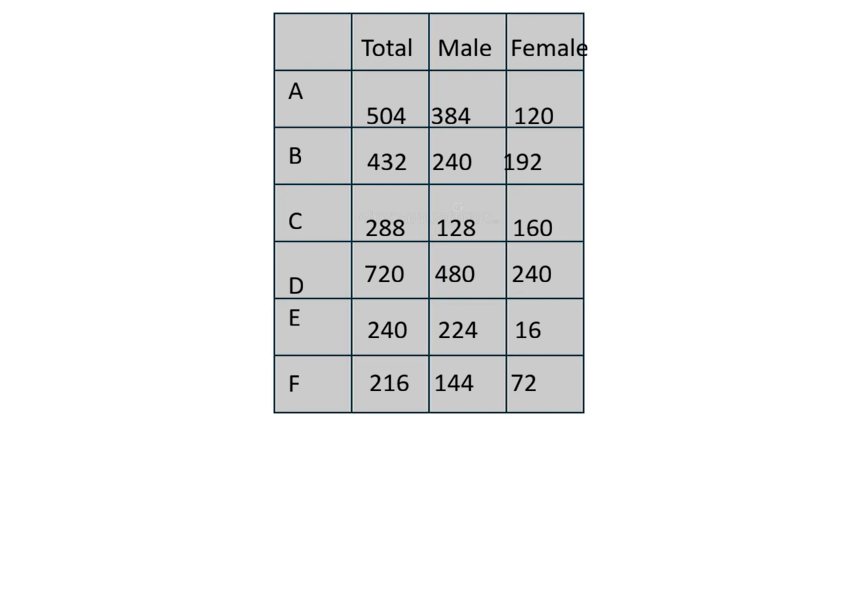
the number of female employees as a percentage for male employees is: 31.25%, 80%, 125%, 50%, 7.14% and 50% for the offices A, B, C, D, E and F respectively.
The number of female employees as a percentage of male employees is second lowest in office A.
Get AI Help
Video Solution
Click on the Email ☝️ to Watch the Video Solution

SRCC Quant Questions | SRCC Quantitative Ability
SRCC DILR Questions | LRDI Questions For SRCC
SRCC Verbal Ability Questions | VARC Questions For SRCC
Free SRCC DILR Questions
Book Free CAT Mentorship
Get personalized CAT strategy from a 99%iler
500+ students mentored
OTP Verification
Enter the 6-digit code sent to your phone
Booking Summary
Enter OTP
Didn't receive the OTP?


