Question 59
Study the graph and answer the question that follows.
The given chart represents the demand and production of leather bags of five companies U, V, X, Y and Z.
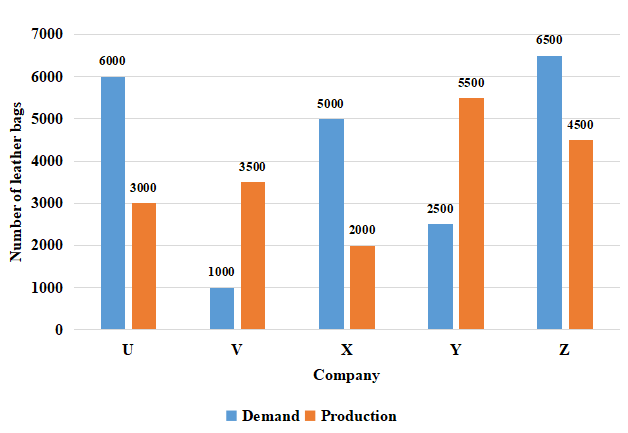
If the production of leather bags by company is equal to 'm' times of the production of leather bags by company X. then the value of 'm' is:
Create a FREE account and get:
- Free SSC Study Material - 18000 Questions
- 230+ SSC previous papers with solutions PDF
- 100+ SSC Online Tests for Free


