Question 59
Study the given graph and answer the question that follows.
The bar graph shows the percentage distribution of total expenditure of a company under various expense heads during a year.
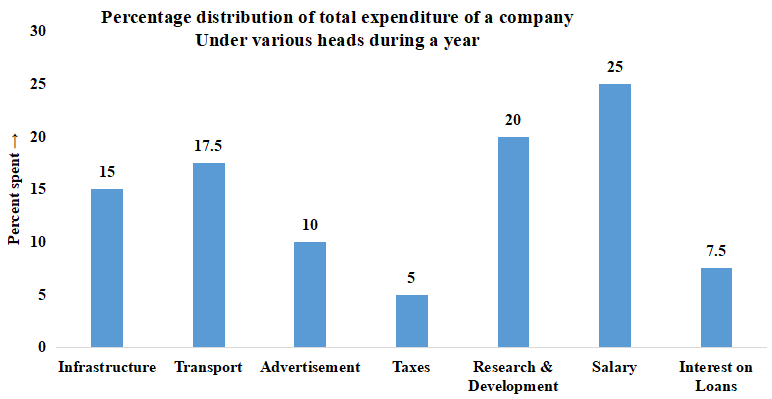
The total expenditure of the company in the year is how many times the expenditure on Research & Development?
Create a FREE account and get:
- Free SSC Study Material - 18000 Questions
- 230+ SSC previous papers with solutions PDF
- 100+ SSC Online Tests for Free


