Question 51
Study the given pie chart and answer the question that follows.
The pie chart represents the popularity of ice-cream flavours among families in the year 2019.
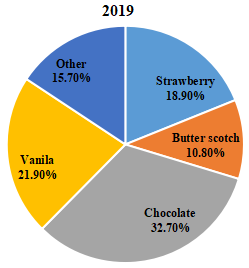
In 2019, if 20% of the ‘Other’ category was Anjeer flavour and 4082 people preferred Anjeer flavour, then how many people were surveyed?
Create a FREE account and get:
- Free SSC Study Material - 18000 Questions
- 230+ SSC previous papers with solutions PDF
- 100+ SSC Online Tests for Free


