Sign in
Please select an account to continue using cracku.in
↓ →
Join Our JEE Preparation Group
Prep with like-minded aspirants; Get access to free daily tests and study material.
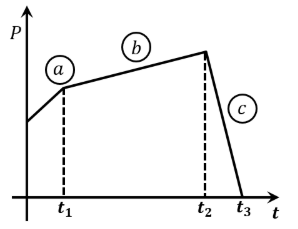
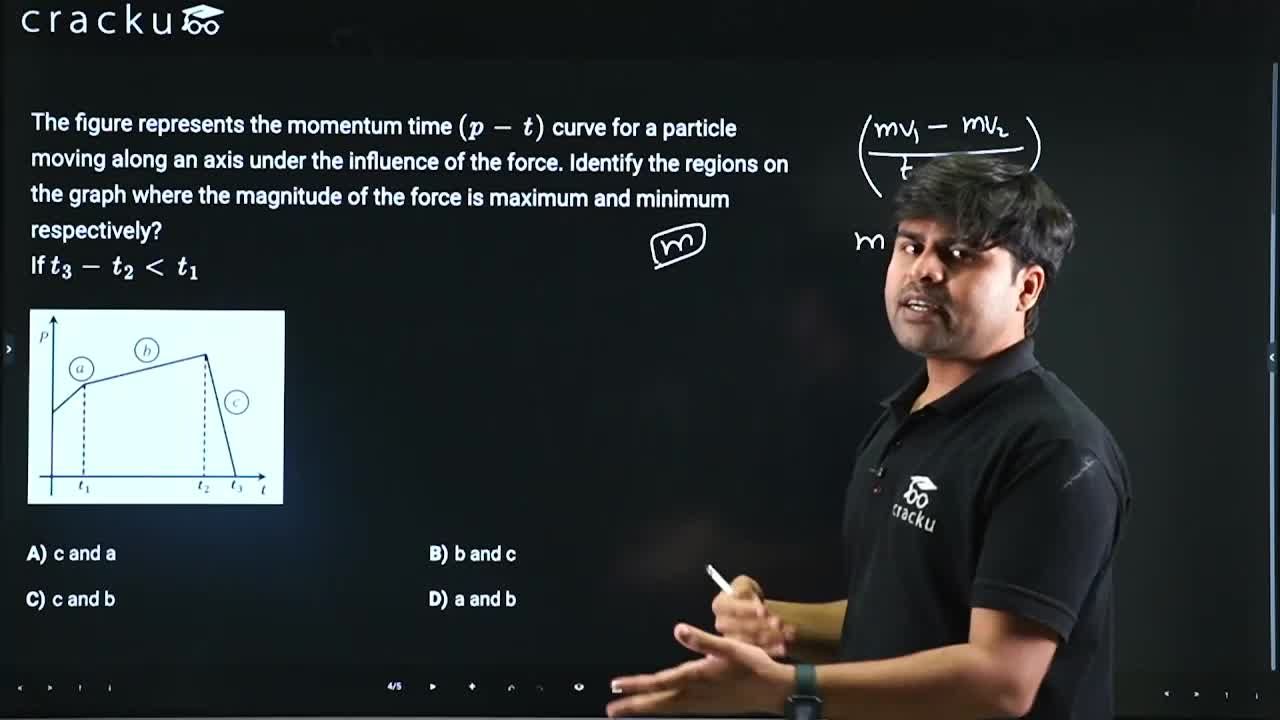
The figure represents the momentum time $$(p - t)$$ curve for a particle moving along an axis under the influence of the force. Identify the regions on the graph where the magnitude of the force is maximum and minimum respectively?
If $$t_3 - t_2 < t_1$$
Given ,
A momentum-time graph is given,
p-t
momentum p=mv
as m is constant , graph is directly proportional to v
so the slope of the graph is the acceleration
$$\ F=ma$$
So higher the slope higher the Force
Observe the graph, order of slopes is
c>b>a
Therefore maximum force is in c and minimum force is in b
Click on the Email ☝️ to Watch the Video Solution
Create a FREE account and get:


Educational materials for JEE preparation

Ask our AI anything

AI can make mistakes. Please verify important information.
AI can make mistakes. Please verify important information.
