Sign in
Please select an account to continue using cracku.in
↓ →
Join Our JEE Preparation Group
Prep with like-minded aspirants; Get access to free daily tests and study material.
An LCR circuit is equivalent to a damped pendulum. In an LCR circuit the capacitor is charged to $$Q_0$$ and then connected to the L and R as shown below:
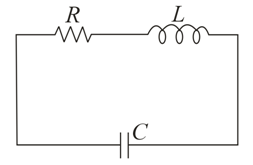
If a student plots graphs of the square of maximum charge $$(Q_{Max}^2)$$ on the capacitor with time (t) for two different values $$L_1$$ and $$L_2$$ ($$L_1 > L_2$$) of L then which of the following represents this graph correctly? (plots are schematic and not drawn to scale)
The discharging of a capacitor in a series LCR circuit is analogous to a damped harmonic oscillator, such as a damped pendulum. The resistor $$R$$ acts as the damping element, dissipating energy and causing the amplitude of the charge to decay exponentially over time.
The maximum charge $$Q_{Max}$$ on the capacitor at any time $$t$$ represents the envelope of the damped oscillation:
$$Q_{Max} = Q_0 e^{-\frac{Rt}{2L}}$$
$$Q_{Max}^2 = \left( Q_0 e^{-\frac{Rt}{2L}} \right)^2 = Q_0^2 e^{-\frac{Rt}{L}}$$
A larger inductance results in a smaller decay constant ($$\frac{R}{L}$$), meaning the charge amplitude decreases more slowly (slower decay).
Given that $$L_1 > L_2$$, the decay for $$L_1$$ is slower than for $$L_2$$. Consequently, for any time $$t > 0$$, the curve for $$L_1$$ will remain at a higher value than the curve for $$L_2$$.
Create a FREE account and get:


Educational materials for JEE preparation

Ask our AI anything

AI can make mistakes. Please verify important information.
AI can make mistakes. Please verify important information.
