Sign in
Please select an account to continue using cracku.in
↓ →
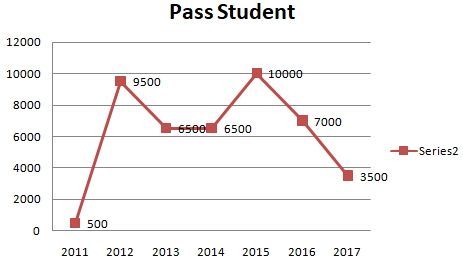
The line graph shows the number of students of a certain university who passed in the given year in their final exams. Study the diagram and answer the following questions.

Year
If students who pass are given a certificate, what is the number of certificates awarded in the last three years?
Number of certificates awarded in the last three years = Number of students who passed in 2015, 2016 and 2017
= 10000 + 7000 + 3500
= 20500
=> Ans - (C)
Create a FREE account and get:
Educational materials for CAT preparation