Instructions
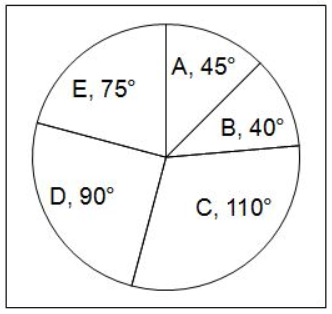
The given pie chart shows the distribution (in degrees) of cars sold of different models by a company in 2015-16.
Question 147
If the number of cars sold of model D is 40500, what is the ratio between the number of cars sold of model D and E?
Solution
Ratio of cars sold by D and E is given by,
(90 degrees) : (75 degrees)
6 : 5
(Note: Here we can ignore the number of cars sold as we need to find the ratio)
Hence, option B is the correct answer.
Get AI Help
Create a FREE account and get:
- Free SSC Study Material - 18000 Questions
- 230+ SSC previous papers with solutions PDF
- 100+ SSC Online Tests for Free


