Sign in
Please select an account to continue using cracku.in
↓ →
Join Our JEE Preparation Group
Prep with like-minded aspirants; Get access to free daily tests and study material.
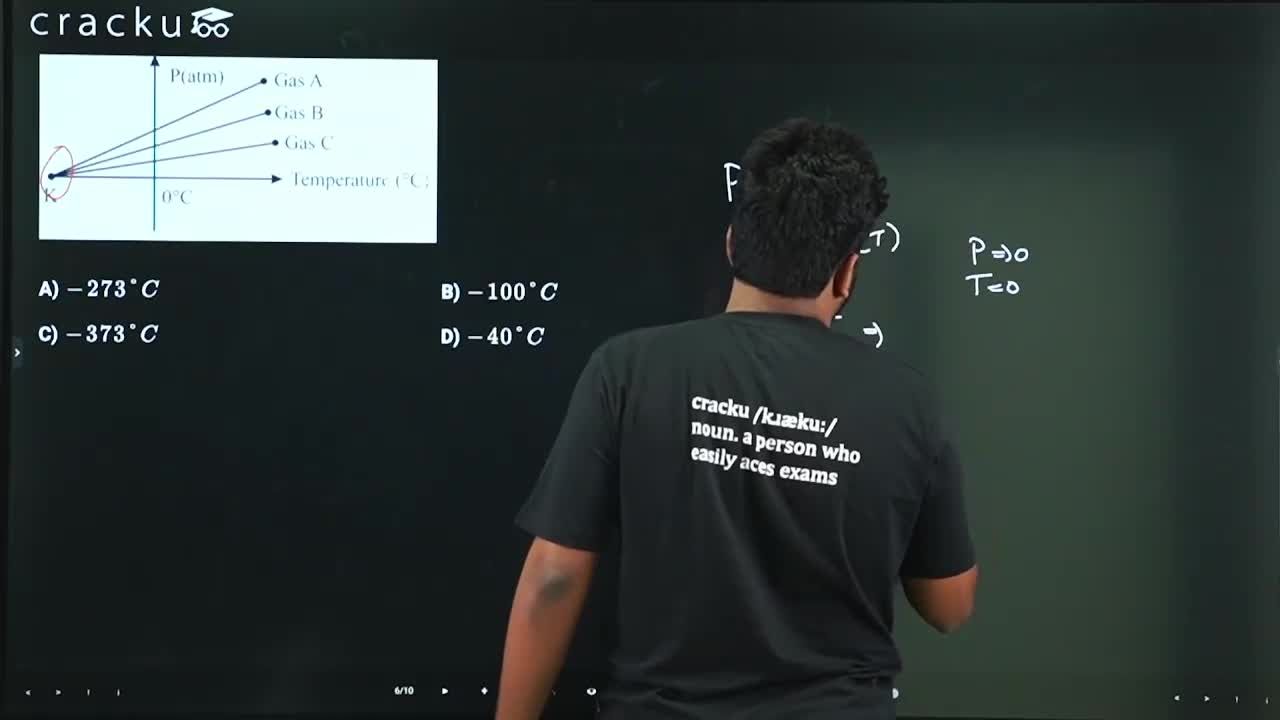
For three low density gases $$A, B, C$$ pressure versus temperature graphs are plotted while keeping them at constant volume, as shown in the figure. The temperature corresponding to the point '$$K$$' is:
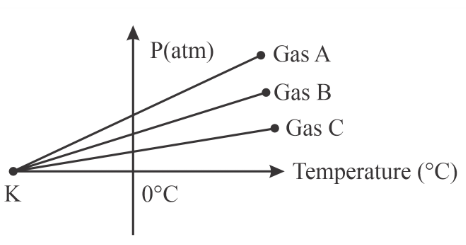
For a gas at constant volume,
$$PV=nRT$$
so
$$P=\frac{nR}{V}T$$
This shows pressure is directly proportional to absolute temperature (Kelvin), not Celsius.
If temperature is written in Celsius (t), then
$$T=t+273$$
So
$$P=\frac{nR}{V}(t+273)$$
When pressure becomes zero,
$$t=-273^{\circ}C$$
This is absolute zero.
All straight lines extrapolate to meet the temperature axis at this same point K.
Therefore point K corresponds to
$$-273^{\circ}C$$
Click on the Email ☝️ to Watch the Video Solution


Educational materials for JEE preparation

Ask our AI anything

AI can make mistakes. Please verify important information.
AI can make mistakes. Please verify important information.