What is the author’s main objective in writing the passage ?
SBI PO 2010 2nd exam
Read the following passage carefully and answer the question given below it.Certain words/phrases have been printed in bold to help you locate them while answering some of the question.
Governments have traditionally equated economic progress with steel mills and cement factories. While urban centers thrive and city dwellers get rich, hundreds of millions of farmers remain mired in poverty.However fears of food shortages, a rethinking of anti-poverty priorities and the crushing recession in 2008 are causing a dramatic shift in world economic policy in favour of greater support for agriculture.
The last time when the world’s farmer felt such love was in the 1970s. At that time, as food prices spiked, there was real concern that the world was facing a crisis in which the planet was simply unable to produce enough grain and meat for an expanding population.Government across the developing world and international aid organisations plowed investment into agriculture in the early 1970s, while technological breakthroughs, like high-yield strains of important food crops, boosted production. The result was the Green Revolution and food production exploded.
But the Green Revolution became a victim of its own success.Food prices plunged by some 60% by the late 1980s from their peak in the mid-1970s. Policy makers and aid workers turned their attention to the poor’s other pressing needs such as health care and education. Farming got starved of resources and investment. By 2004 aid directed at agriculture sank to 3.5 % and Agriculture lost its glitter. Also as consumer in high-growth giants such as China and India became wealthier they began eating more meat so grain once used for human consumption got diverted to beef up livestock. By early 2008 panicked buying by importing countries and restrictions slapped on grain exports by some big producers helped drive prices upto heights not seen for three decades. Making matters worse land and resources got reallocated to produce cash crops such as biofuels and the result was that voluminous reserves of grain evaporated. Protests broke out across the emerging world and fierce food riots toppled governments.
This spurred global leaders into action. This made them aware that food security is one of the fundamental issues in the world that has to be dealt with in order to maintain administrative and political stability. This also spurred the US which traditionally provisioned food aid from American grain surpluses to help needy nations to move towards investing in farm sectors around the globe to boost productive for themselves and be in a better position to feed their own people.
Africa, which missed out on the first Green Revolution due to poor policy and limited resources, also witnessed a 'change'. Swayed by the success of East Asia the primary poverty-fighting method favoured by many policy-makers in Africa was to get farmers off their farms and into modern jobs in factories and urban centers. But that strategy proved to be highly insufficient. Income levels in the countryside badly trailed those in cities while the FAO estimated that the number of poor going hungry in 2009 reached an all time high at more than one billion.
In India on the other hand with only 40% of its farmland irrigated, entire economic boom currently underway is held hostage by the unpredictable monsoon. With much of India’s farming areas suffering from drought this year, the government will have a tough time meeting its economic growth targets. In a report Goldman Sachs, predicted that if this year, too receives weak rains it could cause agriculture to contract by 2 % this fiscal year making the government 7%GDP growth target look "a bit rich". Another green revolution is the need of the hour and to make it a reality, the global community still has much backbreaking farm work to do.
Solution
Login to view the detailed solution.
Which of the following is an adverse impact of the Green Revolution ?
Solution
Login to view the detailed solution.
What is the author trying to convey through the phrase making the government 7 % GDP growth target look a bit rich ?
Solution
Login to view the detailed solution.
Which of the following factors was/were responsible for the neglect of the farming sector after the Green Revolution ?
A. Steel and cement sectors generated more revenue for the government as compared to agriculture
B. Large-scale protests against favouring agriculture at the cost of other important sectors such as education and health care
C. Attention of policy makers and aid organisations was diverted from agriculture to other sectors
Solution
Login to view the detailed solution.
What prompted leaders throughout the world to take action to boost the agriculture sector in 2008 ?
Solution
Login to view the detailed solution.
What motivated the US to focus on investing in agriculture across the globe ?
Solution
Login to view the detailed solution.
What impact did economic recession of 2008 have on agriculture ?
Solution
Login to view the detailed solution.
What encouraged African policy-makers to focus on urban jobs ?
Solution
Login to view the detailed solution.
Which of the following had contributed to exorbitant food prices in 2008 ?
(A) Hoarding of food stocks by local wholesalers which inadvertently created a food shortage
(B)Export of foodgrains was reduced by large producers
(C)Diverting resources from cultivation of foodgrains to that of more profitable crops
Which of the following is true about the state of agriculture in India at present ?
(A)Of all the sectors agriculture needs the highest allocation of funds
(B)Contribution of agriculture to India’s GDP this year would depend greatly upon the monsoon rains
(C)As India is one of the high-growth countries it has surplus food reserves export to other nations
Solution
Login to view the detailed solution.
Choose the word/group of words which is most similar in meaning to the word printed in bold as used in the passage: STARVED
Solution
Login to view the detailed solution.
Choose the word/group of words which is most similar in meaning to the word printed in bold as used in the passage: SLAPPED
Solution
Login to view the detailed solution.
Choose the word/group of words which is most similar in meaning to the word printed in bold as used in the passage: PLOWED
Solution
Login to view the detailed solution.
Choose the word which is most opposite in the meaning of the word printed in bold as used in the passage: PRESSING
Solution
Login to view the detailed solution.
Choose the word which is most opposite in the meaning of the word printed in bold as used in the passage: EVAPORATED
Solution
Login to view the detailed solution.
Which of the phrases a, b, c, d given below each statement should be placed in the blank space provided so as to make a meaningful and grammatically correct sentence ? If none of the sentence is appropriate mark e, i,e ‘None of these’ as the answer.
Refuting the rationale behind frequent agitations for formation of separate States a recent report ________
Overlooking the fact that water scarcity intensifies during summer,________
He has lost most of his life’s earning in the stock market but_____-
Achieving equality for women is not only a laudable goal_____
______or else they would not keep electing him year after year
Each question below has two blanks each blank indicating that something has been omitted Choose the set of words for each blank that best fits the meaning of the sentence as a whole.
Drawing attention to the pitfalls of _________solely on Uranium as a fuel for nuclear reactors Indian scientists warned that Uranium will not last for long and thus research on Thorium as its________must be revived.
In an effort to provide ______ for higher education to all most of the universities have been providing education without adequate infrastructure thus churning out ______graduates every year
The move to allow dumping of mercury____an outcry from residents of the area who____that high levels of mercury will affect their health and destroy ecologically sensitive forest area.
______has been taken against some wholesale drug dealers for dealing in surgical items without a valid licence and maintaining a stock of _________drugs
Even as the _______elsewhere in the world are struggling to come out recession India consumers are splurging on consumer goods and to ________this growth companies are investing heavily in various sectors
Rearrange the following sentence (A),(B),(C),(D),(E) and (F) to make a meaningful paragraph and then answer the question which follow:
(A)While these disadvantages of biofuels are serious they are the only alternate energy source of the future and the sooner we find solutions to these problems the faster we will be able to solve the problems we are now facing with gasoline.
(B)This fuel can also help to stimulate jobs locally since they are also much safer to handle than gasoline and can thus have the potential to turn around a global economy.
(C)These include dependence on fossil fuels for the machinery required to produce biofuel which ends up polluting as much as the burning of fossil fuels on roads and exorbitant cost of biofuels which makes it very difficult for the common man to switch to this option
(D)This turnaround can potentially help to bring world peace and end the need to depend on foreign countries for energy requirements
(E)Biofuels are made from plant sources and since these sources are available in abundance and can be reproduced on a massive scale they form an energy source that is potentially unlimited
(F)However everything is not as green with the biofuels as it seems as there are numerous disadvantages involved which at times overshadow their positive impact
Which of the following sentence should be the FIFTH after rearrangement ?
Solution
Login to view the detailed solution.
Which of the following sentence should be the THIRD after rearrangement ?
Solution
Login to view the detailed solution.
Which of the following sentence should be the FIRST after rearrangement ?
Solution
Login to view the detailed solution.
Which of the following sentence should be the SIXTH (LAST) after rearrangement ?
Solution
Login to view the detailed solution.
Which of the following sentence should be the SECOND after rearrangement ?
Solution
Login to view the detailed solution.
Which of the phrases (A),(B),(C),(D), given below each statement should replace the phrase printed in bold in the sentence to make it grammatically correct ? If the sentence is correct as it is given and ‘No correction is required’ mark (E) as the answer.
Soon after the Tsunami had killed thousand of people along the coasts of southern India parliament passes a bill that proposed to set up an institutional mechanism to respond promptly to natural disasters
Solution
Login to view the detailed solution.
Denial of wages forced scientists and teachers at the agriculture universities throughout the country to go on strike crippling crucial research that could help the state of agriculture in the country?
Solution
Login to view the detailed solution.
In an attempt to boost their profits many edible oil producing companies have been engaging themselves in propaganda against commonly used oils and promoting exotic and expensive varieties of oils as more healthier options.
Solution
Login to view the detailed solution.
Thanks to numerous government initiatives rural masses which was earlier unaware of the luxuries of urban ways of living are now connected to the same lifestyle
Solution
Login to view the detailed solution.
Over the last few months while most industries are busy in restructuring operations cutting costs and firing the Indian pharmaceutical and healthcare industry was adding manpower and giving salary hikes
Solution
Login to view the detailed solution.
In the following passage there are blanks each of which has been numbered These numbers are printed below the passage and against each five words/phrases are suggested one of which fits the blank appropriately Find out the appropriate word/phrase in each case
There is a considerable amount of research about the factors that make a company innovate So is it possible to create an environment (186) to innovation ? This is a particularly pertinent (187) for India today Massive problems in health educations etc (188) be solved using a conventional approach but (189) creative and innovative solutions that can ensure radical change and (190) There are several factors in India’s (191)Few countries have the rich diversity that India or its large Young population (192)While these (193) innovation policy interventions certain additional steps are also required These include (194)investment in research and development by (195)the government and the private sectors easy transfer of technology from the academic world etc. To fulfil its promise of being prosperous and to be at the forefront India must be innovative
186
Solution
Login to view the detailed solution.
187
Solution
Login to view the detailed solution.
188
Solution
Login to view the detailed solution.
189
Solution
Login to view the detailed solution.
190
Solution
Login to view the detailed solution.
191
Solution
Login to view the detailed solution.
192
Solution
Login to view the detailed solution.
193
Solution
Login to view the detailed solution.
194
Solution
Login to view the detailed solution.
195
Solution
Login to view the detailed solution.
In each of the following question four words are given of which two words are most nearly the same or opposite in meaning and indicate the number of the correct letter combination by darkening the appropriate oval in your answer sheet
(A)consent (B)nascent (C)emerging (D)insecure
Solution
Login to view the detailed solution.
(A)elated (B)eccentric (C)explicit (D)abnormal
Solution
Login to view the detailed solution.
(A)abundance (B)incomparable (C)projection (D)plethora
Solution
Login to view the detailed solution.
(A)purposefully (B)inaccurately (C)inadvertently (D)unchangeably
Solution
Login to view the detailed solution.
(A)germane (B)generate (C)reliable (D)irrelevant
Solution
Login to view the detailed solution.
For the following questions answer them individually
In a certain code language ‘how many goals scored’ is written as 5 3 9 7 ‘many more matches’ is written as ‘9 8 2’ and ‘he scored five’ is written as ‘1 6 3’. How is ‘goals’ written in that code language ?
Solution
Login to view the detailed solution.
In a certain code TEMPORAL is written as OLDSMBSP How is CONSIDER written in that code ?
Solution
Login to view the detailed solution.
How many meaningful English words can be made with the letters DLEI using each letter only once in each word ?
Solution
Login to view the detailed solution.
Among A,B,C,D and E each having different weight D is heavier than only A and C is lighter than B and E. Who among them is the heaviest ?
Solution
Login to view the detailed solution.
Each odd digit in the number 5263187 is substituted by the next higher digit and each even digit is substituted by the previous lower digit and the digit so obtained are rearranged in ascending order which of the following will be the third digit from the left end after the rearrangement ?
Solution
Login to view the detailed solution.
Pratap correctly remembers that his mother’s birthday is before twentythird April but after nineteenth April whereas his sister correctly remembers that their mother’s birthday is not on or after twentysecond April. On which day in April is definitely their mother’s birthday ?
Solution
Login to view the detailed solution.
Ashok started walking towards South. After walking 50 meters he took a right turn and walked 30 meters. He then took a right turn and walked 100 meters. He again took a right turn and walked 30 meters and stopped. How far and in which direction was he from the starting point ?
Solution
Login to view the detailed solution.
If ‘$$\div$$’ means ‘+’: ‘-’ means ‘$$\times$$: ‘$$\times$$ means ‘$$\div$$’ and ‘+’ means ‘-’: then
$$15-8\times 6 \div 12+4=?$$
Solution
Login to view the detailed solution.
Town D is towards East of town F. Town B is towards North of town D. Town H is towards South of town B. Towards which direction is town H from town F?
Solution
Login to view the detailed solution.
How many such pairs of letters are there in the word SEARCHES each of which has many letters between them in the word as in the English alphabet ?
Solution
Login to view the detailed solution.
In each of the question below are given four statements followed by four conclusions numbered I,II,III, and IV.You have to take the given statements to be true even if they seem to be at variance with commonly known facts Read all the conclusions and then decide which of the given conclusion logically follows from the given statements disregarding commonly known facts
Statements:All cups are bottles.
Some bottles are jugs.
No jug is plate.
Some plates are tables.
Conclusions:I.Some tables are bottles
II.Some plates are cups
III.No table is bottle
IV.Some jugs are cups
Solution
Login to view the detailed solution.
Statements:Some chairs are handles
All handles are pots
All pots are mats
Some mats are buses
Conclusions:I.Some buses are handles.
II.Some mats are chairs.
III.No bus is a handle
IV.Some mats are handles
Solution
Login to view the detailed solution.
Statements:All birds are horses.
All horses are tigers
Some tigers are lions
Some lions are monkeys
Conclusion:I.Some tigers are horses
II.Some monkeys are birds
III.Some tigers are birds.
IV.Some monkeys are horses
Solution
Login to view the detailed solution.
Statements:Some benches are walls.
All walls are houses
Some houses are jungles
All jungles are roads
Conclusions:I.Some roads are benches
II.Some jungles are walls.
III.Some houses are benches
IV.Some roads are houses
Solution
Login to view the detailed solution.
Statement:Some sticks are lamps.
Some flowers are lamps.
Some lamps are dresses
All dresses are shirts.
Conclusion:I.Some shirts are sticks
II.Some shirts are flowers
III.Some flowers are sticks
IV.Some dresses are sticks
Solution
Login to view the detailed solution.
Study the following information carefully and answer the question given below:
A, B,C,D,E,F,G and H are eight employees of an organization working in three departments viz personnel Administration and Marketing with not more than three of them in any department Each of them has a different choice of sports from football cricket volleyball badminton lawn tennis basketball hockey and table tennis not necessarily in the same order
D works in Administration and does not like either football or cricket F works in personnel with only A who likes table tennis E and H do not work in the same department as D C likes hockey and does not work in Marketing G does not not work in Administration and does not like either cricket or badminton, One of those who work in Administration likes football.The one who likes volleyball works in personnel None of those who work in Administration likes either badminton or lawn tennis H does not like cricket
Which of the following groups of employees work in Administration department ?
Solution
Login to view the detailed solution.
In which department does E work ?
Solution
Login to view the detailed solution.
Which of the following combinations of employee department favourite sport is correct ?
Solution
Login to view the detailed solution.
What is E’s favourite sport ?
Solution
Login to view the detailed solution.
What is G’s favourite sport ?
Solution
Login to view the detailed solution.
In the following questions the symbols @,$, $$\bigstar$$, # and $$\delta$$ are used with the following meaning as illustrated below:
‘P $ Q’ means ‘P is not smaller than Q’
‘P @ Q’ means ‘P is neither smaller than nor equal to Q’
‘P # Q’ means ‘P is neither greater than nor equal to Q’
‘P $$\delta$$ Q’ means ‘P is neither greater than nor smaller than Q’
‘P $$\bigstar$$ Q’ means ‘P is not greater than Q’
Now in each of the following question assuming the given statements to be true find which of the four conclusions I,II,III and IV given below them is/are definitely true and give your answer accordingly.
Statements: H @ T, T # F, F $$\delta$$ E, E $$\bigstar$$ V.
Conclusions:I. V $ F
II. E @ T
III. H @ V
IV. T # V
Solution
Login to view the detailed solution.
Statements: D # R, R $$\bigstar$$ K, K @ F, F $ J
Conclusions:I.J # R
II.J # K
III. R # F
IV. K @ D
Solution
Login to view the detailed solution.
Statements: N $$\delta$$ B, B $ W, W # H, H $$\bigstar$$ M
Conclusions: I. M @ W
II.H @ N
III. W $$\delta$$ N
IV. W # N
Solution
Login to view the detailed solution.
Statements: R $$\bigstar$$ D, D $ J, J # M, M @ K
Conclusions: I.K # J
II. D @ M
III. R # M
IV. D @ K
Solution
Login to view the detailed solution.
Statements: M $ K, K @ N, N $$\bigstar$$ R, R # W
Conclusions: I. W @ K
II. M $ K
III. K @ W
IV. M @ N
Solution
Login to view the detailed solution.
Study the following information carefully and answer the question given below:
Following are the conditions for selecting Senior Manager Credit in a bank The candidate must
(i) be a graduate in any discipline with at least 60 per cent marks
(ii) have post-qualification work experience of at least ten years in the Advances Section of a bank.
(iii) be at least 30 years and not more than 40 years as on 1.4.2010
(iv) have secured at least 40 per cent marks in the Group Discussion
(v) have secured at least 50 per cent marks in the Interview
In the case of a candidate who satisfies all the conditions
EXCEPT
(A) at (i) above but has secured at least 50 per cent marks in graduation and at least 60 per cent marks in post- graduation in any discipline the case is to be referred to the General Manager Advances
(B) at (ii) above but has total post qualification work experience of at least seven years out of which at least three years as Manager Credit in a bank the case is to be referred to the Executive Director
In each question below details of one candidate are given you have to take one of the following courses of action based on the information provided and the conditions and sub conditions given above and mark the number of that course of action as your answer You are not to assume anything other than the information provided in each question All these cases are given to you as on 01-04-2010
Shobha Gupta has secured 50 per cent marks in the Interview and 40 per cent marks in the Group Discussion She has been working for the past eight years out of which four years as Manager Credit in a bank after completing her BA degree with 60 per cent marks She was born on 12th September 1978
Solution
Login to view the detailed solution.
Rohan Maskare was born on 8th March 1974. He has been working in a bank for the past twelve years after completing his B Com degree with 70 per cent marks He has secured 50 per cent marks in both the Group Discussion and the Interview
Solution
Login to view the detailed solution.
Prakash Gokhale was born on 4th August 1977.He has secured 65 per cent marks in post graduation and 58 per cent marks in graduation He has been working for past ten years in the Advances Department of the bank after completing his postgraduation He has secured 45 per cent marks in the Group Discussion and 50 per cent marks in the Interview
Solution
Login to view the detailed solution.
Sudha Mehrotra has been working in the Advances Department of a bank for the past twelve years after completing her B Com Degree with 60 per cent marks She has secured 50 per cent marks in the Group Discussion and 40 per cent marks in the Interview She was born on 15th February 1972
Solution
Login to view the detailed solution.
Amit Narayan was born on 28th May 1974 He has been working in the Advances department of a bank for the past eleven years after completing his B Sc Degree with 65 per cent marks He has secured 55 per cent marks in the Group Discussion and 50 per cent marks in the Interview
Solution
Login to view the detailed solution.
In each question below is given a statement followed by three courses of action numbered (A), (B) and (C). A course of action is a step or administrative decision to be taken for improvement follow-up or further action in regard to the problem policy etc. On the basis of the information given in the statement you have to assume everything in the statement to be true then decide which of the suggested courses of action logically follow for pursuing
Statement:A heavy unseasonal downpour during the last two days has paralysed the normal life in the state in which five persons were killed but this has provided a huge relief to the problem of acute water crisis in the state
Courses of action:
(A) The state government should set up a committee to review the alarming situation
(B)The state government should immediately remove all the restrictions on use of potable water in all the major cities in the state
(C)The state government should send relief supplies to all the affected areas in the state
Statement: A large private bank has decided to retrench one-third of its employees in view of the huge losses incurred by it during the past three quarters.
Course of action:
(A) The Govt should issue a notification to general public to immediately stop all transactions with the bank
(B)The Govt should direct the bank to refrain from retrenching its employees
(C)The Govt should ask the central bank of the country to initiate an enquiry into the bank’s activities and submit its report
Statement:Many political activists have decided to stage demonstrations and block traffic movement in the city during peak hours to protest against the steep rise in prices of essential commodities
Courses of action:
(A) The Govt should immediately ban all forms of agitations in the country
(B)The police authority of the city should deploy additional forces all over the city to help traffic movement in the city
(C)The state administration should carry out preventive arrests of the known criminals staying in the city
Statement:The school dropout rate in many districts in the state has increased sharply during the last few years as the parents of these children make them work in the fields owned by others to earn enough for them to get at least one meal a day
Course of action:
(A)The Govt should put up a mechanism to provide foodgrains to the poor people in these districts through public distribution system to encourage the parents to send their wards to school
(B)The Govt should close down some of these schools in the district and deploy the teachers of these schools to nearby schools and also ask remaining students to join these schools
(C)Govt should issue arrest warrants for all the parents who force their children to work in fields instead of attending classes
Statement:One aspirant was killed due to stampede while participating in a recruitment drive of police constables
Course of action:
(A)The officials in charge of the recruitment process should immediately be suspended
(B)A team of officials should be asked to find out the circumstances which led to the death of the aspirant and submit its report within a week
(C)The Govt should ask the home department to stagger the number of aspirants over more number of days to avoid such incidents in future
For the following questions answer them individually
Effect:Majority of the employees of the ailing organisation opted for voluntary retirement scheme and left the organisation with all their retirement benefits within a fortnight of launching the scheme
Which of the following can be a probable cause of the above effect ?
Statement:Most of the companies in IT and ITES sectors in India have started hiring from engineering college campuses this year and are likely to recruit much more than yearly recruitment of the earlier years
Which of the following substantiates the facts stated in the above statement ?
Cause:The Govt has recently increased its taxes on petrol and diesel by about 10 per cent
Which of the following can be a possible effect of the above cause ?
Statement:The Govt has decided to instruct the banks to open new branches in such a way that there is one branch of any of the banks in every village of population 1000 and above or a cluster of villages with population less than 1000 to provide banking services to all the citizens
Which of the following will weaken the step taken by the Govt ?
Study the following information carefully and answer the question given below:
The Centre reportedly wants to continue providing subsidy to consumers for cooking gas and kerosene for five more years.This is not good news from the point of view of reining in the fiscal deficit Mounting subventions for subsidies means diversion of saving by the government from investment to consumption raising the cost of capital in the process The government must cut expenditure on subsidies to create more fiscal space for investment in both physical and social infrastructure It should outline a plan for comprehensive reform in major subsidies including petroleum food and fertilizers and set goal posts
Which of the following is a conclusion which can be drawn from the facts stated in the above paragraph ?
Which of the following is an inference which can be be made from the facts stated in the above paragraph ?
Which of the following is an assumption which is implicit in the facts stated in the above paragraph ?
Study the following information carefully and answer the question given below:
Poverty measurement is an unsettled issue both conceptually and methodologically.Since poverty is a process as well as an outcome many come out of it while others may be falling into it The net effect of these two parallel processes is a proportion commonly identified as the ‘head count ratio’ but these ratios hide the fundamental dynamism that characterises poverty in practice The most recent poverty re-estimates by an expert group has also missed the crucial dynamism In a study conducted on 13,000 households which represented the entire country in 1993-94 and again in 2004-05 it was found that in the ten year period 18.2% rural population moved out of poverty whereas another 22.1% fell into it over this period This net increase of about four percentage points was seen to have a considerable variation across states and regions
Which of the following is a conclusion which can be drawn from the facts stated in the above paragraph ?
Which of the following is an assumption which is implicit in the facts stated in the above paragraph ?
Which of the following is an inference which can be made from the facts stated in the above paragraph ?
In each of the questions given below which one of the five answer figure should come
after the problem figure, if the sequence were continued ?


Study the following table carefully to answer the question that follow:
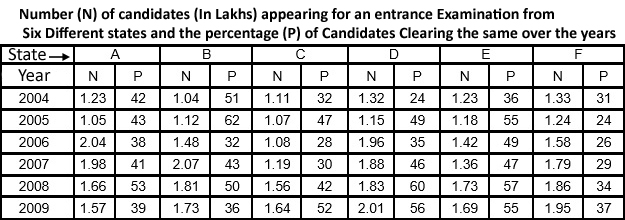
What is the ratio of the total number of candidates clearing the entrance exam from State B in the year 2004 to that of those clearing the entrance exam from State C in the same year?
Solution
Login to view the detailed solution.
In which year did the highest number of candidates clear the entrance exam from state D ?
Solution
Login to view the detailed solution.
What is the number of candidates not clearing the entrance exam from State A in the year 2007 ?
Solution
Login to view the detailed solution.
What is the total number of candidates clearing the entrance exam from states E and F together in the year 2006 ?
Solution
Login to view the detailed solution.
What is the average number of candidates appearing for the entrance exam from state D in the years 2007,2008 and 2009 together ?
Solution
Login to view the detailed solution.
Study the given information carefully and answer the questions that follow:
An urn contains 6 red, 4 blue, 2 green, 3 yellow marbles.
If four marbles are picked at random what is the probability that at least one is blue ?
Solution
Login to view the detailed solution.
If two marbles are picked at random what is the probability that both are red ?
Solution
Login to view the detailed solution.
If three marbles are picked at random what is the probability that two are blue and one is yellow ?
Solution
Login to view the detailed solution.
If four marbles are picked at random what is the probability that one is green two are blue and one is red ?
Solution
Login to view the detailed solution.
If two marbles are picked at random what is the probability that either both are green or both are yellow ?
Solution
Login to view the detailed solution.
Study the given pie-charts carefully to answer the question that follows
Break-up of numbers of employees working in different department of an organisation, the number of males and the number of employees who Recently Got promoted in Each Department
Break-up of the employees working in different departments:
Total number of employees=3,600
Employees working in different departments

Break-up of Number of Males in Each Department
Total number of males in the Organisation = 2,040
Break-up of Number of Males Working in Each Department

Break-up of Number of employees
who recently Got Promoted in each Department
Total number of Employees who got promoted = 1,200
Number of Employees who recently Got Promoted from Each Department
If half of the number of employees who got promoted from the IT department were males what was the approximate percentage of males who got promoted from the IT department ?
Solution
Login to view the detailed solution.
What is the total number of females working in the production and Marketing department together ?
Solution
Login to view the detailed solution.
How many females work in the Accounts department ?
Solution
Login to view the detailed solution.
The total number of employees who got promoted from all the departments together was what per cent of the total number of employees working in all the department together ?
Solution
Login to view the detailed solution.
The number of employees who got promoted from the HR department was what per cent of the total number of employees working in that department ?
Solution
Login to view the detailed solution.
Study the graph carefully to answer the question that follow
Per cent rise in profit of two companies over the years

If the profit earned by company L in the year 2005 was Rs 1.84 lakhs what was the profit earned by the company in the year 2006 ?
Solution
Login to view the detailed solution.
If the profit earned by Company M in the year 2008 was Rs 3.63 lakh what was the amount of profit earned by it in the year 2006 ?
Solution
Login to view the detailed solution.
What is the average per cent rise in the profit of Company L over all the years together ?
Solution
Login to view the detailed solution.
Which of the following statements is True with respect to the above graph ?
Solution
Login to view the detailed solution.
What is the percentage increase in per cent rise in profit of Company M in the year 2009 from the previous year ?
Solution
Login to view the detailed solution.
Study the information carefully to answer the question that follow:
A school consisting of a total of 1560 students has boys and girls in the ratio 7:5 respectively. All the students are enrolled in different types of hobby classes. viz: Singing, Dancing and Painting. One-fifth of the boys are enrolled in only Dancing classes.Twenty per cent of the girls are enrolled in only painting classes. Ten per cent of the boys are enrolled in only Singing classes. Twenty four per cent of the girls are enrolled in both Singing and Dancing classes together. The number of girls enrolled in only Singing classes is two hundred per cent of the boys are enrolled in the same. One thirteenth of the boys are enrolled in all the three classes together. The respective ratio of boys enrolled in Dancing and painting classes together to the girls enrolled in the same is 2:1 respectively. Ten per cent of the girls are enrolled in only Dancing classes whereas eight per cent of the girls are enrolled in both Dancing and painting classes together. The remaining girls are enrolled in all the three classes together. The number of boys enrolled in Singing and Dancing classes together is fifty per cent of the number of girls enrolled in the same. The remaining boys are enrolled in only painting classes.
What is the total number of boys who are enrolled in Dancing ?
Solution
Login to view the detailed solution.
Total number of girls enrolled in Singing is approximately what per cent of the total number students in the school ?
Solution
Login to view the detailed solution.
What is the total number of students enrolled in all the three classes together ?
Solution
Login to view the detailed solution.
Number of girls enrolled in only Dancing classes is what percent of the boys enrolled in the same ?(rounded off to two digit after decimal )
Solution
Login to view the detailed solution.
What is the ratio of the number of girls enrolled in only painting classes to the number of boys enrolled in the same ?
Solution
Login to view the detailed solution.
Study the table carefully to answer the question that follow:
Profit (in Rs ‘000) made by Six Different Shopkeepers over the Months.
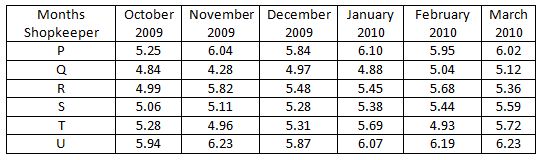
What is the ratio of the profit earned by shopkeeper U in the months February 2010 and March 2010 together to that earned by shopkeeper Q in the same months ?
Solution
Login to view the detailed solution.
What is the per cent increase in the profit of shopkeeper S in the month of December 2009 over the previous month ?
Solution
Login to view the detailed solution.
Which shopkeeper’s profit kept increasing continuously over the given months ?
Solution
Login to view the detailed solution.
What is the difference in profit earned by the shopkeeper T in January 2010 from the previous month?
Solution
Login to view the detailed solution.
What was the average profit earned by shopkeeper R in the months of October 2009 and November 2009 together ?
Solution
Login to view the detailed solution.
Study the given graph carefully to answer the question that follow:
Number of days taken by three carpenters to finish making one piece each of four different items of furniture
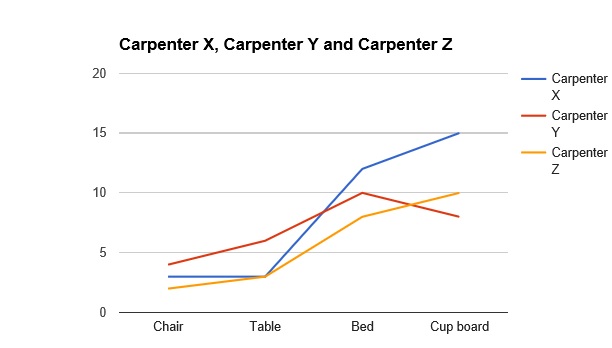
If Carpenter X and Carpenter Y were to make a chair together how many days would they take ?
Solution
Login to view the detailed solution.
If Carpenter X, Y and Z were to make a table together, how many days would they take?
Solution
Login to view the detailed solution.
What is the total number of days that Carpenter Z will take to make one piece each of all the four items together ?
Solution
Login to view the detailed solution.
For the following questions answer them individually
The radius of a circular field is equal to the side of a square field whose perimeter is 784 feet. What is the area of the circular field?
Solution
Login to view the detailed solution.
In how many different ways can the letters of the word STRESS be arranged ?
Solution
Login to view the detailed solution.
Study the given table carefully to answer the questions that follow
Number of people staying in five different localities and the percentage break-up of men women and children in them

Total number of people staying in locality J forms approximately what percent of the total number of people staying in locality F ?
Solution
Login to view the detailed solution.
What is the total number of children staying in localities H and I together ?
Solution
Login to view the detailed solution.
The number of women staying in which locality is the highest ?
Solution
Login to view the detailed solution.
What is the total number of men and children staying in locality I together ?
Solution
Login to view the detailed solution.
What is the ratio of the number of men staying in locality F to the number of men staying in locality H?
Solution
Login to view the detailed solution.
For the following questions answer them individually
The compound interest earned by Suresh on a certain amount at the end of two years at the rate of 8 p.c.pa was Rs 1,414.40. What was the total amount that Suresh got back at the end of two years in the form of principal plus interest earned ?
Solution
Login to view the detailed solution.
The ratio of the present ages of a mother and daughter is 7:1 Four years ago the ratio of their ages was 19:1 what will be the mother’s age four years from now ?
Solution
Login to view the detailed solution.
Three friends J K and L jog around a circular stadium and complete one round in 12, 18 and 20 seconds respectively In how many minutes will all the three meet again at the starting point ?
Solution
Login to view the detailed solution.
4 men can complete a piece of work in 2 days. 4 women can complete the same piece of work in 4 days whereas 5 children can complete the same piece of work in 4 days. If 2 men 4 women and 10 children work together in how many days can the work be completed ?
Solution
Login to view the detailed solution.
The speed of boat when travelling downstream is 32 km/hr whereas when travelling upstream it is 28 km/hr. What is the speed of the boat in still water ?
Solution
Login to view the detailed solution.
Study the following tables carefully and answer the question given below:
Number of Candidates appeared in a Competitive Examination from Five Centers over the years.
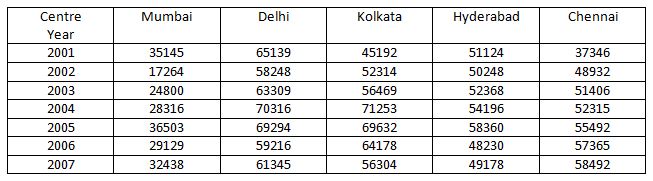
Approximate percentage of Candidates Qualified to Appeared in the Competitive Examination from Five Centers over the year.

In which of the following years was the difference in number of candidates appeared from Mumbai over the previous year the minimum ?
Solution
Login to view the detailed solution.
In which of the following years was the number of candidates qualified from Chennai the maximum among the given years ?
Solution
Login to view the detailed solution.
Approximately what was the total number of candidates qualified from Delhi in 2002 and 2006 together ?
Solution
Login to view the detailed solution.
Approximately how many candidates appearing from Kolkata in 2004 qualified in the competitive examination ?
Solution
Login to view the detailed solution.
Approximately what was the difference between the number of Candidates qualified from Hyderabad in 2001 and that in 2002 ?
Solution
Login to view the detailed solution.
For the following questions answer them individually
What is the full form of ‘NBFC’ as used in the Financial Sector ?
As per the news published in various financial newspapers the RBI is reworking the roadmap on Capital Account Convertibility.If this is done who amongst the following would be able to invest in foreign projects or acquire assets outside India without any restrictions ?
(A)Public Sector Banks
(B)Companies which are registered in India
(C)Govt of India
(D)Any Individual
Many a time we read about Special Drawing Right (SDR) in newspapers As per its definition SDR is a monetary unit of the reserve assets of which of the following organisation agencies ?
Which of the following is/are the highlights of the Union Budget 2010-11 ?
(A) A number of new steps taken to simplify the Foreign Direct Investment (FDI) regime
(B)Rs 16,500 cr provided to ensure that the Public Sector Banks are able to attain a minimum 8% capital (Tier I ) by Mar 2011
(C)More than Rs 1,74,000 cr provided for the development of the infrastructure in the country
As per the news published in major financial newspapers the Union Govt is planning to divest 20% stake in the state owned Hindustan Copper Ltd What does it really mean ?
As per the newspaper reports the Govt of India made an auction of the Third Generation Spectrum (3G) recently Which of the following ministries was actively involved in the process ?
As per a recent announcement the Govt of India will provide an amount of Rs 48,000 cr to develop Rural Infrastructure in the country.This planned development is being undertaken under which of the following schemes ?
As per the current practice the maximum part of the Global Foreign Exchange Reserves (more than 60%) and Foreign Exchange Transactions (more than 90%) take place in only one currency all over the world which is that currency ?
The RBI Governor in one of his speeches made a mention of Inflation Index to target as there are several such indices Which of the following statements is CORRECT in this regard ?
Which of the following agencies/organisation has recently decided that all the Stock Exchanges should introduce physical settlement of equity derivatives ?
Recently India took part in Nuclear New Build 2010 Conference organised in
Which of the following schemes announced in the Union Budget 2010-11 will have direct impact on the pricing pattern of fertilizers ?
As we know with the launch of Nano by Tatas India has become favourite Small Car Destination of the world Other than India Which of the following countries is also a popular destination of small cars ?
Many economists and financial analysts are of the opinion that India could withstand the recent global economic crisis comfortably because of a good fiscal consolidation and Govts adherence to the targets fixed by the
As per the decision taken by the competent authorities the Qualified Institutional Buyers (QIBs) are required to pay 100% application money to make them eligible to bid for public issues How much amount were the QIBs paying as application or margin money prior to this decision ?
The Finance Minister of India in one of his speeches said that the current high inflation is not because of monetary expansion but due to supply side bottlenecks in certain essential commodities This means that the Finance Minister is of the view that
(A)the liquidity position in market is quite comfortable these days
(B)inflation being experienced these days is not cost push inflation
(C)markets are flooded with luxury goods but essential commodities are definitely in short supply
North Korea and USA decided to resume their peace talks after a gap of several months Both the countries have a dispute over which of the following issues ?
Who amongst the following was the Chairperson of the 13th Finance Commission which submitted its report to the President of India recently ?
As per the news published in various newspapers the RBI is considering the grant of licence to some new companies particularly NBFCs to act as full-fledged banks Which of the following will be considered an NBFC ?
As per the newspaper report China is likely to drop its special ‘Yuan’ policy soon. What is this special Yuan policy being followed by China at present ?
(A)China had initiated the policy of Yuan exchange rate with dollar to Yuan since 2008 at a specified rate decided by it and not by the market forces
(B)China has initiated a policy which says that all payments in China should be done in Yuan only US and some other nations do not agree with this
What is an “intranet” ?
Which of the following groups of cricket teams was declared joint winner of the Col.Ck Naidu Trophy for 2009 ?
Kaiane Aldorino who was crowned Miss World 2009 is from which of the following countries ?
Which of the following teams won the Davis Cup tennis finals 2009 ?
Who amongst the following is the recipient of the CNNIBN Indian of the Year Award for 2009?
The deficit reduction plan of which of the following countries was reviewed recently in the meeting of the Finance Ministers of the European Union ?
The database administrator’s function in an organization is
Every device on the Internet has a unique _____address (also called an ‘Internet address) that identifies it in the same way that a street address identifies the location of a house
To send another station a message the main thing a user has to know is ____
In a client/server model a client program
Control in design of an information system is used to
Each of the following is a true statement except:
A set of inter-related components that collect process store and distribute information to support decision making and control in an organization best defines
A _____is a computer connected to two networks
When you save a presentation _______
In a customer database a customer’s surname would be keyed into a
Find the correct statement
Storing same data in many places is called _____
Which of the following is the first step in the transaction processing cycle which captures business data through various modes such as optical scanning or at an electronic commerce website ?
CRM (Customer Relationship Management) is
Bancassurance can be sold to
Cross-selling is not effective for which one of the following products ?
Which of the following is not involved in the Growth Strategies of a Company ?
A successful ‘Blue Ocean Strategy’ requires
Cross-Selling is the basic function of
Data mining means analysing the data stored with
SME means
One of the following is not included in the 7 P’s of Marketing Find the same
The target group for SME loans is
Home Loans can be best canvassed among

