Which of the following is exactly in the middle between F and B in the above arrangement?
SBI PO 2005
Study the following arrangement carefully and answer the question given below:
4 M % R E 3 # F J 2 $$\div$$ T V 7 U $ N 9 P ¡ A * 5 H Q 8 X W 6 B I D + O K
Solution
Login to view the detailed solution.
How many such consonants are there in the above arrangement, each of which is immediately preceded by a symbol and immediately followed by a consonant ?
Solution
Login to view the detailed solution.
How many such consonants are there in the above arrangement, each of which is immediately followed by a consonant ?
Solution
Login to view the detailed solution.
How many such vowels are there in the above arrangement, each of which is immediately preceded by a consonant and immediately followed by a number?
Solution
Login to view the detailed solution.
If the positions of the last fifteen elements in the above arrangement are reversed, which of the following will be the eighth to the right of the twentieth from the right end?
Solution
Login to view the detailed solution.
For the following questions answer them individually
If it is possible to make only one meaningful word the first, the fifth, the seventh and the eleventh letters of the word ENVIRONMENT, which of the following will be the third letter of that word? If more than one such word can be formed, give ‘D’ as the answer and if no such word can be formed, give ‘X’ as the answer.
Solution
Login to view the detailed solution.
How many such pairs of letters are there in the word PREAMBLE each of which has as many letters between them in the word as in the English alphabet ?
Solution
Login to view the detailed solution.
The position of how many such letters in the word BRAKES remain unchanged when they are arranged in alphabetical order ?
Solution
Login to view the detailed solution.
Which of the following three digit number will be second largest among them after 2 is subtracted from the middle digit of each number and the positions of the first and the third digits are interchanged ?
Solution
Login to view the detailed solution.
The positions of the first and the second digits in the number 94316875 are interchanged. Similarly the positions of the third and the fourth digits are interchanged and so on. Which of the following will be the third to the left of the seventh digit from the left end after the rearrangement?
Solution
Login to view the detailed solution.
Four of the following five are alike in a certain way and so form a group. Which is the one that does not belong to that group ?
Solution
Login to view the detailed solution.
Four of the following five are alike in a certain way and so form a group. Which is the one that does not belong to that group ?
Solution
Login to view the detailed solution.
Four of the following five are alike in a certain way and so form a group. Which is the one that does not belong to that group ?
Solution
Login to view the detailed solution.
In a certain code, BRAIN is written as *%$$\div$$#$$\times$$ and TIER is written as $#+%. How is RENT written in that code ?
Solution
Login to view the detailed solution.
In a certain code, COMPATIBLE is written as BQNPDDKAHS. How is STABILISED written in that code ?
Solution
Login to view the detailed solution.
Pointing to Mukesh, Seema says ‘’He is the only grandchild of my father’’. How is Seema related to Mukesh ?
Solution
Login to view the detailed solution.
(a) ‘M $$\times$$ N’ means ‘N is brother of M’
(b) ‘M $$\div$$N’ means ‘M is father of N’.
(c) ‘M - N’ means ‘M is sister of N’
(d) ‘M + N’ means ‘M is mother of N’
Which of the following means J is nephew of R ?
Solution
Login to view the detailed solution.
Which of the following statements is/are superfluous to answer the previous question " Is J the nephew of R" ?
Solution
Login to view the detailed solution.
For the following questions answer them individually
Four of the following five are alike in a certain way and so form a group. Which is the one that does not belong to that group ?
Solution
Login to view the detailed solution.
If each of the vowel in the word OVEN is changed to previous letter in the English alphabet and the consonants are changed to next letter of the English alphabet. How many meaningful words can be formed with the new letters using each letter only once in each word ?
Solution
Login to view the detailed solution.
In the following questions, the symbols ó, $, #, $$\star$$ and $$\delta$$ are used with the following meaning as illustrated below:
‘P ó Q’ means ‘P is neither smaller than nor equal to Q’
‘P # Q’ means ‘P is not greater than Q’
‘P $$\delta$$ Q’ means ‘P is neither smaller than nor greater than Q’
‘P $ Q’ means ‘P is not smaller than Q’
‘P $$\star$$ Q’ means ‘P is neither equal to nor greater than Q’
Statements : M $$\delta$$ R, R $ W, W $$\star$$ T
Conclusions: I. M ó T
II. W # M
III. T ó R
Solution
Login to view the detailed solution.
Statements: J # N, K $$\star$$ N, B $$\delta$$ K
Conclusions: I. B $$\star$$ N
II. J $$\star$$ N
III. B $$\star$$ J
Solution
Login to view the detailed solution.
Statements: D $$\delta$$ V, V # M, M $$\star$$ K
Conclusions: I. K ó D
II. V $$\star$$ K
III. M $ D
Solution
Login to view the detailed solution.
Statements: F $ A, N $$\delta$$ A, K $$\star$$ N
Conclusions: I. N ó F
II. K ó F
III. N ó F
Solution
Login to view the detailed solution.
Statements: W ó T, T $$\delta$$ J, M $ J
Conclusions: I. M $$\delta$$ T
II. W ó M
III. M ó T
Solution
Login to view the detailed solution.
Study the following information carefully and answer the given questions:
A word and number arrangement machine when give an input line of words and number rearranges them following a particular rule in each step. The following is an illustration of input and rearrangement.
Input: by now 25 72 sight 37 15 home
Step I : sight by now 25 72 37 15 home
Step II : sight 15 by now 25 72 37 home
Step III : sight 15 now by 25 72 37 home
Step IV : sight 15 now 25 by 72 37 home
Step V : sight 15 now 25 home by 72 37
Step IV : sight 15 now 25 home 37 by 72
And Step Vi is the last step of the rearrangement.
As per the rules followed in the above steps, find out in each of the following questions the appropriate step for the given input
Input: ask for me 49 32 64 and 24
Which of the following will be Step III ?
Solution
Login to view the detailed solution.
Step III of an input is:
yellow 12 tire 92 84 36 goal life
How many more steps will be required to complete the rearrangement?
Solution
Login to view the detailed solution.
Step II of an input is:
victory 19 22 34 age bear high 24
Which of the following will be Step VII ?
Solution
Login to view the detailed solution.
Input: go now and come 72 34 57 25
How many steps will be required to complete the rearrangement ?
Solution
Login to view the detailed solution.
Step IV of an input is : now 17 mother 23 car know 47 31
How many more steps will be required to complete the rearrangements ?
Solution
Login to view the detailed solution.
Study the following information carefully and answer the questions given below:
M, J, K, D, R, P, and V are seven employees of an organization. Three of them are in one Grade and two each in the other two Grades among A, B and C. Each of them earns different amounts as salary. There are ladies among them in each grade. K and her husband only are in Grade B. V earns the maximum and he along with the only D are in Grade A. D earns more than only M. P and her friend J are in Grade C. M is not in Grade C. P earns less than K but more than J. R earns less than J.
Which of the following groups represents the three ladies ?
Solution
Login to view the detailed solution.
Which of the following combinations of persons are in Grade C?
Solution
Login to view the detailed solution.
Who earns less than only V?
Solution
Login to view the detailed solution.
How many of them earn more than R ?
Solution
Login to view the detailed solution.
The one who earns the least is in which grade ?
Solution
Login to view the detailed solution.
In each of the questions below are given three statements followed by four conclusions numbered I, II, III and IV. You have to take the given statements to be true even if they seem to be variance from commonly known facts. Read all the conclusions and then decide which of the given conclusions logically follows from the given statements disregarding commonly known facts.
Statements: Some rooms are windows. All houses are windows.
Some bats are houses
Conclusions: I. Some bats are rooms
II. Some windows are bats
III. Some windows are houses
IV. Some houses are rooms
Solution
Login to view the detailed solution.
Statements: All books are tiles.
Some roads are tiles.
All pens are roads.
Conclusions: I. Some books are roads
II. Some pens are books
III. Some pens are tiles
IV. All tiles are books
Solution
Login to view the detailed solution.
Statements: All pencils are birds. All birds are skies.
All skies are hills.
Conclusions: I. All pencils are hills
II. All hills are birds
III. All skies are pencils
IV. All birds are hills
Solution
Login to view the detailed solution.
Statements: All dogs are fruits. No chair is fruit.
Some chairs are clowns
Conclusions: I. Some clowns are dogs
II. Some chairs are dogs
III. No chair is dog
IV. No dog is clown
Solution
Login to view the detailed solution.
Statements: Some buses are jungles. Some jungles are lions.
Some lions are rivers
Conclusions: I. Some buses are rivers
II. Some lions are buses
III. Some jungles are rivers
IV. All lions are either jungles or rivers
Solution
Login to view the detailed solution.
In making decision about important questions, it is desirable to be able to distinguish between ‘strong’ arguments and ‘weak’ arguments. ‘Strong’ arguments are those which are both important and directly related to the question. ‘Weak’ arguments are those which are of minor importance and also may not be directly related to the question or may be related to a trivial aspect of question.
Each question below is followed by two arguments numbered I and II. You have to decide which of the argument is a ‘strong’ argument and which is a ‘weak’ argument.
Should India create a large stockpile of nuclear weapons ?
Arguments: I. Yes, this will help the country to withstand the threat of its enemies.
II. No, instead the money should be diverted to development activities.
Should the seats in the professional colleges be reserved only for students belonging to lower economic strata ?
Arguments: I. Yes, this will help the poor students irrespective of their caste and creed achieve their dream of attaining professional education.
II. No, the seats should be reserved for backward castes and classes of people to help them come out of the oppression of upper caste people.
Should all those who are convicted for murder beyond all reasonable doubts be given death penalty ?
Arguments: I. No,the death penalty should be given only in very rare and exceptional cases.
II. Yes, this is the only way to punish such people who take other’s lives.
Should there be only one type of Govt. tax on all commodities and services in India ?
Arguments: I. Yes, this will simplify the process of collecting tax and will also benefit the tax payers.
II. No, no other country has adopted such simplified tax collection system.
Should India change its course from the economic reform process and look inward for all round economic development ?
Arguments: I. No, there is no way to look backward after having started the process.
II. Yes, this will benefit India in the long run as the reform process borrowed from western countries will adversely affect our economy.
Below is given a passage followed by several possible inferences which can be drawn from the facts started in the passage. You have to examine each inference separately in the context of the passage and decide upon its degree of truth or falsity.
Just when the FMCG industry is beginning to show some signs of revival, oil prices and rising inflation threaten to play spoilsport. Even though input and packaging costs have been rising for sometime now, companies had learnt to live with this as long as volumes remained healthy. Even today, a large section of the industry feels that demands for consumer goods will not be impacted substantially due to the increase in petrol, diesel and LPG prices---corporates are wary that disposable income will get reduced with the rise in fuel costs. They, however, are concerned that their respective bottomlines are likely to be eroded against the backdrop of rising raw material and packaging costs and the inability to increase prices due to competition. At the same time, they say, the diesel price hike is not expected to add to costs immediately as most of them have long term contracts with transporters.
The profit of the FMCG companies largely depends on the volume of business at a given year.
The spending capacity of the buyers may remain unaffected after the fuel price hike.
The FMCG companies have not been making much profits in the past.
The FMCG companies do not have much competition in the market.
The FMCG companies make more profit comparative to other companies.
Each of the questions below consists of a question and two statements numbered I and II given below it. You have to decide whether the data provided in the statements are sufficient to answer the question. Read both the statements and
How many students are there between M and J in a row of sixty children?
I. M is twenty-seventh from the right end of the row.
II. J is twenty-second from the left end of the row.
Solution
Login to view the detailed solution.
How is ‘never’ written in a code language ?
I. ‘never go there’ is written as ‘ha da pa’ in that code language.
II. ‘go home now’ is written as ‘da na ja’ in that code language.
Solution
Login to view the detailed solution.
Among V, D, K, T, J and R who is shorter than only tallest among them ?
I. D is taller than V and J.
II. R is taller than V but shorter than T.
Solution
Login to view the detailed solution.
A is sister of B. How are B and D related to each other ?
I. D is brother of B.
II. F is sister of D.
Solution
Login to view the detailed solution.
Among F, H, K, R and B who reached office last ?
I. H and K reached office together.
II. Only F and R reached office ahead of K.
Solution
Login to view the detailed solution.
Below in each question are given two statements (I) and (II). These statements may be either dependent causes or may be effects of independent causes. One of these statements may be effect of the other statement. Read both statements and decide which of the following answer choice correctly depicts the relationship between those two statements.
I. The Government has reduced the prices of petroleum products by five per cent a week after increasing the prices by ten per cent.
II. The rate of inflation dropped marginally during the last week.
I.The literacy rate in the district has been increasing for the last four years.
II. The district administration has conducted extensive training programme for the workers involved in the literacy drive.
I. All the schools in the area had to be kept closed for most part of the week.
II. Many parents have withdrawn their children from the local schools.
I. Police resorted to lathi charge to disperse the unlawful gathering of large number of people.
II. The citizens’ forum called a general strike in protest against the police atrocities.
I. The Government has decided to hold a single entrance test for admission to all the medical colleges in India.
II. The state government has debarred students from other students to apply for the seats in the medical colleges in the state.
In each of the following questions series begins with unnumbered figure on the extreme left. One and only one of five numbered figures in the series does not fit into the series. The two unnumbered figures one each on the extreme left and the extreme right fit into the series. You have to take as many aspects into account as possible of the figures in the series and find out one and only one of the five numbered figures which does not fit into the series. The number of that figure is the answer.


in each of the following questions, a related pair of figures (numbered) is followed by five numbered pairs of figures. Out of these five, four have relationship similar to that in the unnumbered pair. Only one pair of figures does not have similar relationship. Select that pair of figures which does not have a similar relationship tot that in the unnumbered pair. Number of that pair is your answer.


In each of the questions given below which one of the five figures on the right shoulde come after the problem figures on the left, if the sequence were continued ?


What will come in the place of question mark (?)
$$(a)^{c}\times(b)^a\times?=0$$, if a, b, c are not equal to 0.
Solution
Login to view the detailed solution.
$$((a)^2)^?=(a)^6$$
Solution
Login to view the detailed solution.
$$?\times(\mid a \mid \times \mid b \mid)=-ab$$, where a, b > 0
Solution
Login to view the detailed solution.
$$(c)^0\div b=?$$
Solution
Login to view the detailed solution.
$$((a)^b)^?=1$$, where a $$\neq$$ 1 and b $$\neq$$ 0.
Solution
Login to view the detailed solution.
Study the following graphs carefully and answer the questions given below:
Number of candidates appeared (In thousands) and Percentage of candidates qualified in a Competitive examination over the years


What was the ratio between the number of candidates appeared in 1997 and the number of candidates qualified in 2004 ?
Solution
Login to view the detailed solution.
In which of the following years was the number of candidates qualified the lowest among the given years ?
Solution
Login to view the detailed solution.
What was the percentage drop in the number of candidates appeared from the year 2002 to 2003 ?
Solution
Login to view the detailed solution.
How many candidates qualified in the year 2002 ?
Solution
Login to view the detailed solution.
The number of candidates qualified in 1999 was what percentage of the number of candidates appeared in 1998?
Solution
Login to view the detailed solution.
For the following questions answer them individually
The area of the square of side 8 cm is equal to a rectangle. Which of the following statements/is/are definitely true about the rectangle (Sides of the rectangle are integers)?
Solution
Login to view the detailed solution.
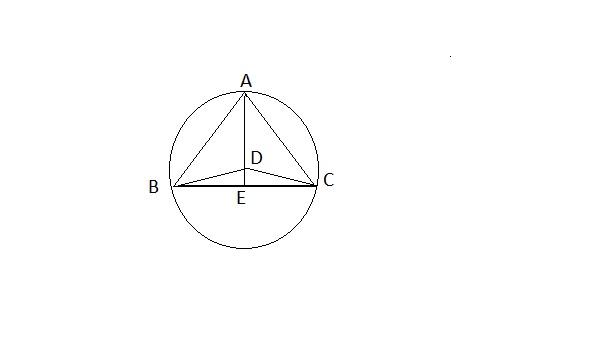
In the following figure, ABC is an equilateral triangle which is inscribed inside a circle and whose radius is r. Which of the following is the area of the triangle ?
Solution
Login to view the detailed solution.
When a two-digit odd number is divided by a two digit even number, the quotient is 0.625. If the odd is 5 less than the even number, then which of the following will definitely be the ratio of the odd and even numbers respectively ?
Solution
Login to view the detailed solution.
A shopkeeper bought three varieties A, B and C of rice in different amounts at the rates of Rs. 34.50, Rs. 28.60 and Rs. 32.40 per kg respectively. In which of the following transactions he will gain maximum ?
Solution
Login to view the detailed solution.
Two third of one-fourth of a number is forty percent of another number. Which of the following statements is true about these numbers ?
Solution
Login to view the detailed solution.
Study the following table to answer these questions:
Break up of expenditure under various plans (in Rs.Millions)

If one of the following graphs were to represent the spending on water supply and sanitation in various plans, which of the following graphs will suit the best?


Solution
Login to view the detailed solution.
The expenditure on social services was highest in which plan ?
Solution
Login to view the detailed solution.
In which sector can a continuous decrease in the expenditure (over the plans- from I to IV) can be witnessed?
Solution
Login to view the detailed solution.
For plan Vl, what is the ratio of expenditure on health to that of family planning?
Solution
Login to view the detailed solution.
For all the given plans, what was the total difference in expenditure on education and health ?
Solution
Login to view the detailed solution.
In each question, two equations I and II have been given. You have to solve these equations and give the appropriate answer
I. $$p^2+13p+40=0$$
II. $$q^2+7q+12=0$$
Solution
Login to view the detailed solution.
I. $$p=(-10)^2$$
II. $$q^2+q-9900=0$$
Solution
Login to view the detailed solution.
I. $$p^2-5p+6=0$$
II. $$q^2-4q+3=0$$
Solution
Login to view the detailed solution.
I. $$p^2=100$$
II. $$q=10$$
Solution
Login to view the detailed solution.
I. $$p=\pm100$$
II. $$q=(10000)^\frac{1}{2}$$
Solution
Login to view the detailed solution.
For the following questions answer them individually
The radius of a circle is 20% more than the height of a right angled triangle. The base of triangle is 36 cm. If the area of triangle and circle be equal, what will be the area of circle ?
Solution
Login to view the detailed solution.
In a one-day cricket match the captain of one of the teams scored 30 runs more than the average runs scored by the remaining six batsmen of that team who batted in the match. If the total runs scored by all the batsman of that team were 310, how many runs did the captain score ?
Solution
Login to view the detailed solution.
Mohan distributed his total assets to his wife, three sons, two daughters and five grandchildren in such a way that each grandchild got one-eighth of each son or one-tenth of each daughter. His wife got 40 per cent of the total share of his sons and daughters together. If each daughter received asset of worth Rs. 1.25 lakh. what was the total worth of the assets received by his wife and his five grandchildren together ?
Solution
Login to view the detailed solution.
The present ages of A, B and C are in the ratio of 8: 14: 22 respectively. The present ages of B, C and D are in ratio of 21: 33: 44 respectively. Which of the following represents the ratio of the present ages of A, B, C and D respectively ?
Solution
Login to view the detailed solution.
Seven men, five women and eight children were given an assignment of distributing 2000 books to students in a school over a period of three days. All of them distributed books on the first day. On the second day two women and three children remained absent and on the third day three men and five children remained absent. If the ratio of the number of books distributed in a day by a man, a woman and a child was 5: 4: 2 respectively, a total of ‘’approximately’’ how many books were distributed on the second day ?
Solution
Login to view the detailed solution.
In each of the following questions, a question and three statements I, II and III are given. You have to decide whether the data given in the statements are sufficient to answer the question or not.
How much profit did the company earn in the year 2002 ?
I. The company earned 40% more profit in the year 2003 than that in the year 2001.
II. The company earned a total profit of Rs. 20 crores in the year 2001 and 2002 taken together.
III. In the year 2003, the company earned 80 per cent profit of that in 2002.
Solution
Login to view the detailed solution.
In an institute employing managers, observers and assistants, what is the monthly salary of an assistant ?
I: Each observer gets Rs. 12000 per month more than an assistant.
II: An observer and an assistant together get Rs. 32000 per month.
III: The total salary per month of a manager and an observer is Rs. 57000.
Solution
Login to view the detailed solution.
What is the circumference of semi-circle in cm ?
I. The area of semi-circle is half of the area of parallelogram.
II. The length of the parallelogram is 1.5 times the radius of the semi-circle.
III. The difference between the length and breadth of parallelogram is 8 cm.
Solution
Login to view the detailed solution.
In a partnership business A, B and C what profit did B get at the end of 2 years ?
I. A and B started the business by investing in ratio 3: 5.
II. C joined after 6 months with Rs. 4 lakhs.
III. After two years, A’s share in profit was Rs. 60000.
Solution
Login to view the detailed solution.
How many students secured at least 60 per cent marks in Mathematics in a class of 240 students ?
I. 20 percent of the students in the class secured 80 per cent and above marks in Mathematic.
II. 80 students have secured more than 50 per cent but less than 60 percent marks in Mathematics.
III. The number of students who secured marks between 60 and 79 percent was equal to the number of students who secured less than 50 per cent marks in Mathematics.
Solution
Login to view the detailed solution.
For the following questions answer them individually
The average of four numbers A, B, C and D is 40. The average of four numbers A, B, E and F is also 40. (A, B are common). Which of the following must be true ?
Solution
Login to view the detailed solution.
A select group of 4 is to be formed from 8 men and 6 women in such a way that the group must have atleast one woman. In how many different ways can it be done ?
Solution
Login to view the detailed solution.
In a sample , if a person is picked up randomly, the probability that the person is a smoker is $$\frac{3}{5}$$, and that of the person being male is $$\frac{1}{2}$$ .What is the probability that the person is both male as well as a smoker ?
Solution
Login to view the detailed solution.
On five chairs arranged in a row, five persons A, B, C, D and E are to be seated in such a way that B and D always sit together (side by side). In how many different ways can it be done ?
Solution
Login to view the detailed solution.
The average (Arithmetic Mean) and the Median of a set of numbers is the same. Which of the following must be true ?
Solution
Login to view the detailed solution.
Study the following table carefully to answer the questions given below:

In which of the following years there was maximum improvement in degree of malnutrition in comparison to previous year ?
Solution
Login to view the detailed solution.
Talking all the years together mild degree is ‘’approximately’’ what per cent of malnutrition ?
Solution
Login to view the detailed solution.
For the given years, how many were normal of the total surveyed number ?
Solution
Login to view the detailed solution.
Out of the total number of survey in 1998, how many cases were of moderate and serious degree of malnutrition ?
Solution
Login to view the detailed solution.
From 1998 to 2004, ‘’approximately’’ what per cent of decrease was observed in moderate cases %?
Solution
Login to view the detailed solution.
Study the following graph carefully and answer the questions given below:

What was the difference between the average production of sugar during the year 1998, 1999, 2000, 2001 and that of 2001, 2002, 2003 and 2004 in thousand metric tons ?
Solution
Login to view the detailed solution.
In which of the following years was the percentage increase in value of sugar per metric ton from the previous year the maximum ?
Solution
Login to view the detailed solution.
In which of the following years was the value of sugar per metric ton the highest among the given years ?
Solution
Login to view the detailed solution.
In which of the following years was the value of sugar per metric ton the lowest among the given years ?
Solution
Login to view the detailed solution.
The total production in which of the following pairs of years is equal to 25 per cent of total production in all the years together ?
I. 1998 and 2004
II. 1998 and 2003
III. 1999 and 2001
Solution
Login to view the detailed solution.
Read the following passage carefully and answer the questions given below it. Certain words/phrases have been printed in ‘’bold’’ to help you locate them while answering some of the questions.
As increasing dependence on information systems develops, the need for such system to be reliable and secure also becomes more essential. As growing numbers of ordinary citizens use computer networks for banking, shopping, etc., network security in potentially a ‘’massive’’ problem. Over the last few years, the need for computer and information security system has become increasingly evident, as web sites are being defaced with greater frequency, more and more denial-of-service attacks are being reported, credit card information is being stolen, there is increased sophistication of hacking tools that are openly available to the public on the Internet, and there is increasing damage being caused by viruses and worms to critical information system resources.
At the organizational level, institutional mechanism have to be designed in order to review policies, practices, measures and procedures to review e-security regularly and assess whether these are appropriate to their environment. It would be helpful if organizations share information about threats and vulnerabilities, and implement procedures of rapid and effective cooperation to prevent, detect and respond to security incidents. As new threats and vulnerabilities are continuously discovered there is a strong need for co-operation among organizations and, if necessary, we could also consider cross-border information sharing. We need to understand threats and dangers that could be ‘’vulnerable’’ to and the steps that need to be taken to ‘’mitigate’’ these vulnerabilities. We need to understand access control systems and methodology, telecommunications and network security, and security management practise. We should be well versed in the area of application and systems development security, cryptography, operations security and physical security.
The banking sector is ‘’poised’’ for more challenges in the near future. Customers of banks can now look forward to a large array of new offerings by banks, from an ‘’era’’ of mere competition, banks are now cooperating among themselves so that the synergistic benefits are shared among all the players. This would result in the information of shared payment networks (a few shared ATM networks have already been commissioned by banks), offering payment services beyond the existing time zones. The Reserve Bank is also facilitating new projects such as the Multi Application Smart Card Project which, when implemented, would facilitate transfer of funds using electronic means and in a safe and secure manner across the length and breadth of the country, with reduced dependence on paper currency. The opportunities of e-banking or e-power is general need to be harnessed so that banking is available to all customers in such a manner that they would feel most convenient, and if required, without having to visit a branch of a bank. All these will have to be accompanied with a high level of comfort, which again boils down to the issue of e-security.
One of the biggest advantages accruing to banks in the future would be the benefits that arise from the introduction of Real Time Gross Settlement (RTGS). Funds management by treasuries of banks would be helped greatly by RTGS. With almost 70 banks having joined the RTGS system, more large value funds transfer are taking place through this system. The implementation of Core Banking solutions by the banks is closely related to RTGS too. Core Banking will make anywhere banking a reality for customers of each bank. while RTGS bridges the need for inter-bank funds movement. Thus, the days of depositing a cheque for collection and a long wait for its realization would soon be a thing of the past for those customers who would opt for electronic movement of funds, using the RTGS system, where the settlement would be on an almost ‘’instantaneous’’ basis. Core Banking is already in vogue in many private sector and foreign banks; while its implementation is at different stages amongst the public sector banks.
IT would also facilitate better and more scientific decision-making within banks. Information system now provide decision-makers in banks with a great deal of information which, along with historical data and trend analysis, help in the building up of efficient Management Information Systems. This, in turn, would help in better Asset Liability Management (ALM) which, today’s world of hairline margins is a key requirement for the success of banks in their operational activities. Another benefit which e-banking could provide for relates to Customer Relationship Management (CRM). CRM helps in stratification of customers and evaluating customer needs on a holistic basis which could be paving the way for competitive edge for banks and complete customer care for customer of banks.
The content of the passage ‘’mainly’’ emphasizes----
Solution
Login to view the detailed solution.
What, according to the passage , is the ‘’prerequisite’’ to lessen the threats of hacking?
Solution
Login to view the detailed solution.
In what way does IT catalyse better decision making ?
I: By providing updated data and trend analysis
II: By providing increasing opportunities of personal contacts
III: By ensuring better asset-liability management
Solution
Login to view the detailed solution.
What is the advantage of RTGS to the customers ?
Solution
Login to view the detailed solution.
What, according to the author, should be the ultimate goal(s) of e-banking ?
I. Customers’ convenience
II. Avoidance of heavy footfall of customers in bank branches
III. Protection of customers, interests
Solution
Login to view the detailed solution.
Why it is obligatory that a system should be perfectly dependable ?
Solution
Login to view the detailed solution.
Which of the following is/are recommended by the author to ensure security of banking transactions ?
I. Continuous re-examination of policies and procedures
II. Ensuring appropriateness of the security measures
III. Co-operation among various users to identify and prevent threat
Solution
Login to view the detailed solution.
Which of the following statements is definitely ‘’FALSE’’ in the context of the passage ?
I. Transfer of the funds to any part of the country through electronic media is under active consideration.
II. Co-operation among various competing banks is helpful to all of them in sharing legitimate benefits.
III. Assessment of customer needs and their clustering in homogeneous groups provides competitive edge to banks.
Solution
Login to view the detailed solution.
Computer-savvy citizens are also scared to transact on-line due to the following ‘’except’’-----
Solution
Login to view the detailed solution.
Choose the word which is ‘’MOST OPPOSITE’’ in meaning to the word printed in ‘’bold’’ as used in the passage.
‘’Instantaneous’’
Solution
Login to view the detailed solution.
Choose the word which is ‘’MOST OPPOSITE’’ in meaning to the word printed in ‘’bold’’ as used in the passage.
‘’Vulnerable’’
Solution
Login to view the detailed solution.
Choose the word which is ‘’MOST OPPOSITE’’ in meaning to the word printed in ‘’bold’’ as used in the passage.
‘’Massive’’
Solution
Login to view the detailed solution.
Choose the word which is ‘’MOST NEARLY’’ the ‘’SAME’’ in meaning as the word printed in ‘’bold’’ as used in the passage.
"Era"
Solution
Login to view the detailed solution.
Choose the word which is ‘’MOST NEARLY’’ the ‘’SAME’’ in meaning as the word printed in ‘’bold’’ as used in the passage.
‘’Poised’’
Solution
Login to view the detailed solution.
Choose the word which is ‘’MOST NEARLY’’ the ‘’SAME’’ in meaning as the word printed in ‘’bold’’ as used in the passage.
‘’Mitigate’’
Solution
Login to view the detailed solution.
In each of the following sentences there are two blanks spaces. Below each sentence there are five pairs of words denoted by ‘’letters;; (A), (B), (C), (D) and (E). Find out which pairs of words can be filled up in the blanks in the sentence in the same sequence to make the sentence grammatically correct and meaningful complete.
Most people are too …. in their own lives to ….. much about the agonies of others.
Solution
Login to view the detailed solution.
Doctors and lawyers ….. that advertising will certainly ….. their profession adversely.
Solution
Login to view the detailed solution.
Because the ……. leading to cancellation of fight were murky, the Minister appointed a Commission to …… and report the matter
Solution
Login to view the detailed solution.
Several plots ….. in various television episodes.
By ….. of their athletic activities, a few sportsmen are able to escape the pressures that living in …. can create
Solution
Login to view the detailed solution.
Which of the phrases (A), (B), (C), and (D) given below should replace the phrase given in ‘’bold’’ in the following sentence to make the sentence grammatically meaningful and correct. If the sentence is correct as it is and no correction required, mark (E) as the answer.
It is now well-known that the ‘’world response to’’ the Asian tsunami disaster with an outpouring of generosity.
Solution
Login to view the detailed solution.
The most important quality a chief executive candidate ‘’should have a’’ noble character.
Solution
Login to view the detailed solution.
What is needed now is not mere declarations or promises, but actions - actions to fulfill the ‘’promises already made’’.
Solution
Login to view the detailed solution.
What we ‘’have done’’ is from humanity point of view ?
Solution
Login to view the detailed solution.
Despite considerable achievement in other areas, humans still cannot control weather and ‘’probably never be able’’ to do so.
Solution
Login to view the detailed solution.
The newly-wed couple was shocked when it was observed that many people who ‘’had been invited’’, missing.
Solution
Login to view the detailed solution.
Though people ‘’should be right to protest", it should not be by upsetting the livelihood of others
Solution
Login to view the detailed solution.
They have made a futile attempt of suppressing the truth ‘’and suggest falsehood"
Solution
Login to view the detailed solution.
Because his work as a painter ‘’requires that he use’’ products containing strong chemicals, he has developed skin allergy---
Solution
Login to view the detailed solution.
From time to time, there ‘’have been reports’’ of how children had tried to imitate their favourite hero and landed in trouble.
Solution
Login to view the detailed solution.
We are happy to note that ‘’the use of emission controls was’’ created to reduce air pollution.
Solution
Login to view the detailed solution.
Although he was seen with a drug-peddler, ‘’he is not necessarily himself a drug-peddler’’.
Solution
Login to view the detailed solution.
Optimism coupled with ‘’faith in and hopes of’’ future is the key to progress
Solution
Login to view the detailed solution.
We have already identified areas where landslides are possible and ‘’start evacuation’’ of residents to safer locations
Solution
Login to view the detailed solution.
The law that now stands abolished was a ‘’flawed and discriminatory peace of ‘’ legislation
Solution
Login to view the detailed solution.
GIven below is the first sentence of a paragraph followed by six other disarranged sentences which are denoted by (A), (B), (C), (D), (E) and (F). Rearrange these six sentences to make a meaningful paragraph, keeping the first sentence as the starter of the para and then answer the questions that follow.
Starter: Twenty-five centuries ago, when the Greek traveller Herodotus visited the already ancient monument of Egypt, he found that the tourists had gotten there first.
(A) The Egyptians built for enternity
(B) The ‘why’ is easy: religious beliefs that sought prepetuation in masses of stones so ponderous they must be measures in tons and acres and that demanded that these material manifestations of faith be only huge but permanent.
(C) Tourists are still coming to Egypt and are probably still inscribing their names on the old stones.
(D) In words of Ramses II, who dedicated the magnificent temple of Medinet Habut in the 13th Century B.C., this was to be ‘’a place of the Lord of the Gods, forever’’.
(E) Their names were scratched on the crumbling ruins in hundreds of ancient languages.
(F) They are probably sharing another experience too-standing in silent and involuntary admiration before the great structures and silently posing those inevitable questions: Why ? How ?
Which of the following should be the FIFTH sentence after the starter ?
Solution
Login to view the detailed solution.
Which of the following should be the FIRST sentence after the starter ?
Solution
Login to view the detailed solution.
Which of the following should be the SIXTH (LAST) sentence after the starter ?
Solution
Login to view the detailed solution.
Which of the following should be the FOURTH sentence after the starter ?
Solution
Login to view the detailed solution.
Which of the following should be the SECOND sentence after the starter ?
Solution
Login to view the detailed solution.
In the following passage there are blanks, each of which has been ‘’numbered’’. These ‘’numbers’’ are printed below the passage against each, five words are suggested, one of which fits the blank appropriately. Find out the appropriate words without changing the meaning of the passage.
Capital investment is essential for ….(216)... of productive capacity and adding new capacity for current and future industrial growth. The …. (217).... of this article is to make an assessment of capital investment in the private corporate sector, which would provide important insights into the business expectations about performance of economy in …(218)... and the infrastructure and manufacturing sectors in … (219)... The Method of …(220)... growth in corporate investment should, ideally, be based on the available means of financing an investment project. The bulk of the major projects in the private corporate sector is ….(221)... by the leading all India term-lending institutions namely the Industrial Development Bank of India (IDBI), the Industrial Finance Corporation of India (IFCI), the Industrial Investment Bank OF India (IIBI), ICICI Ltd. (now ICICI Bank) and the Infrastructure Development Finance Company (IDFC). The financial sector reforms in the 1990’s have, in effect,...(222)... the sources of financing corporate projects; in particular, commercial banks have, in recent years, started…(223)...financial assistance to corporate projects. Since a majority of the private corporate entities, undertaking large projects, ….(224)... the termlending institutions and banks for financing the project cost, the phasing details of capital expenditure available in the relevant project reports would provide a base for estimating …(225)... growth in capital expenditure.
216
Solution
Login to view the detailed solution.
217
Solution
Login to view the detailed solution.
218
Solution
Login to view the detailed solution.
219
Solution
Login to view the detailed solution.
220
Solution
Login to view the detailed solution.
221
Solution
Login to view the detailed solution.
222
223
Solution
Login to view the detailed solution.
224
Solution
Login to view the detailed solution.
225
For the following questions answer them individually
V. Shantha, who is the recipient of the Ramon Magsaysay Award announced recently is associated with which of the following fields ?
Which of the following is/are the main features of the ‘National Employment Guarantee Act’ which was in news recently ?
I: The act gives a legal guarantee of employment in rural areas to anyone who is willing to do casual manual labour.
II: The labour engaged in the work under the Act will be paid statutory minimum wages.
III. Any adult who wishes to work under the Act is entitled to be employed on public works within 15 days. Failing that an unemployment allowance has been paid.
The Kyoto Protocol which came into effect from Feb. 2005, is not accepted by two major industrial countries. These countries are
Miss, Natalie Glebova who was crowned Miss Universe---2005 belongs to which of the following countries ?
‘PIN’ in Smart Card is called
The National Agricultural Marketing Federation of India (NAFED) is now authorized to procure which of the following commodities under price support system? The commodity was being procured by a corporation set up exclusively for the same uptill now.
Which of the following states decided to waive the Stamp Duty worth Rs. 25 crores to be charged on transfer of airport property currently owned by the Airport Authority of India ?
‘DOS’ floppy disk does not have
Which of the following correctly describes what TAPP-4 is ?
Which of the following countries has decided to lift a four year ban on the import of sugar from India?
The process of the ratification of European Union’s constitution by the member countries is going on these days. What effect the process has brought on the EURO ?(Pick up the correct statement)
The President of which of the following countries recently visited USA and in an interview to CNN said ‘’The people of my country now feel that they own that country. Operations that involve knocking on people’s door, must stop, must not be done without the permission of the Government of the country’’?
Very often we hear about LIberalisation and deregulation. What does it really means in the area of financial sector? (Pick up the statement which do/does not fall under the terms liberalization and/or de-regulation) ?
I. Giving the freedom to banks etc. to decide interest rates on various products.
II. Announcing a uniform policy for job protection of existing workforce.
III. Removal of direct control over credit and mandatory investment regulations.
IV. Free entry to new competitors
V. Support to mergers and acquisitions.
Open System Interconnection (OSI) Model in the area of Computer/TT, consists of
Firewalls are used to protect a communication network/system against
‘MICR’ technology used for clearance of cheques by banks refersto
Which of the following multinational banks is planning to buy MBNA a leading provider of credit cards in a cash and stocks deal worth US $ 35 billion ?
The Union Cabinet has approved the planning Commission’s Mid Term of the 10th Plan. In order to achieve growth target envisaged by the MTA. The economy must grow annually by the rate of
The word ‘FTP’ as used in the field of computer stands for
The right to Information Bill was recently passed by the Parliament. As per the provision of the same which of the following groups of people will be provided required information without any fees whereas others will have to pay some fees ?
Indian Prime Minister was recently on a three day visit to USA. Which of the following is true about the same ?
I. Both the countries agreed to promote use of nuclear energy for civilian purposes.
II. Prime Minister addressed a joint session of the US Congress.
III. USA agreed to support India in its move to get a permanent seat in UN Security Council.
Compiler in a computer system is a
The Government of India recently constituted the National Commission of farmers. Which of the following is not one of the terms of reference given to the commission
I. Farming is given the status of the industry and the activity of the commercial production of the same now needs a registration with the Registrar of Companies/Firms.
II. Measures are suggested to enhance the quality and cost competitiveness of agricultural commodities. Producers are now allowed to decide the cost of their products independently.
III. NABARD is now permitted to provide credit to the farmers directly like any other commercial banks.
The Government of India recently decided to make amendments in certain Acts. Amendments in which of the following Acts will have direct and greater impact on banking sector ?
I. Reserve Bank of India Act
II. Companies Act
III. Foreign Exchange Monitoring Act
The issue of generation of nuclear power by private sector was in news recently. Which of the following statements represents Government’s view in this regard ? (as reported it in the press)
I. Government is not in favour of allowing private-sector to set up nuclear reactor plants as it wishes to keep the same with it only.
II. Government is of the view that private companies can be allowed to set up nuclear power plants like any other.
III. Government cannot open this sector for private parties as the issue of the use of nuclear power comes under the preview of International agencies and no country can take decision on it single-handedly.
The term ‘Multiplexing’ as used in the area of Computer/IT means
The term Binary means
Mrs. Sushma Chawla’s name was in news recently as she has taken over as the chairperson of
Taina Sachdev’s name is associated with which of the following games/sports ?
The Government of India has decided to remove the cap on voting rights for foreign investors in Indian private banks. As of now the voting rights of foreign investors were limited to
Which of the following expenditures is now exempted from the Fringe Benefit Tax (FBT) introduced recently ?
Which is the most common method being used by Indian banks for sending funds quickly from one city to another ?
Bio-metric Recognition does not include
The Government of India has constituted a task force to prepare a long term development plan for which of the following states with Dr. C. Rangarajan as its Chairman ?
Which of the following is/are the purpose(s) owing to which of Committee known as Trade and Economic Relation Committee (TERC) is constituted by the Government of India ?
I. To finalise details and carry out preparation ahead of foreign visits of the Union Ministers.
II. It will serve as a Think Tank-cum-Imple-mentation Agency for various agreements/pacts with other nations.
III. It is an agency to establish better relations between the Union and the State Govt. and also amongst the various states.
The Income Tax exemption limit for senior citizens above the age of 65 years is raised to the level of
The Government of India is planning to invest around Rs. 40,000 crore through public-private partnership model for revamping airports in India. The plan is to complete the job by the year.
While doing the services from bank, the bank has installed some important rules. According to this the customers who are being given services are being charged. Among these out services which are being charged
I. Buying DD
II. Going to bank oftenly
III. The customer who has having account in Bank who uses his ATM very ferquently
World heritage day was celebrated on
Microprocessor is made for
In 2005 French Open Women’s Lawn Tennis who won the title
For knowing Tsunami on sea’s which system has been developed among these ?
Recently, AIDS Research Institute has conducted HIV vaccination on humans. Among these which country has developed the vaccination?
Which among the following countries had played final of Sultan Azlan Shah Hockey in 2005
Which word is related to processing the speed in computers ?
WTO has influenced Indian economy very much. Among these which decision has been taken by WTO on which India is requiring some reforms in WTO. Among these circumstances which of the following is true ?
I. Decreasing Direct Tax
II. Decreasing tax on imports
III. Giving more and more liberation for or giving license or diluting the restrictions
Kings cross station was in news recently is among which cities
The Commander of army while leaving a foreign country after their long presence in it gave his/her good bye message which says ‘’Brothers in arms thank you for your sacrifices’’. The Commander was from which of the following countries and which was the nation to whom farewell was being given ?
The theme of which of the following International Summits held recently was ‘Make Poverty History’?
In DBMS. Columns are called……..and rows ………. are called

