Question 75
The following bar graph shows the demand and production (in Lakhs) of motor cycles of five different companies A, B, C, D and in 2020.
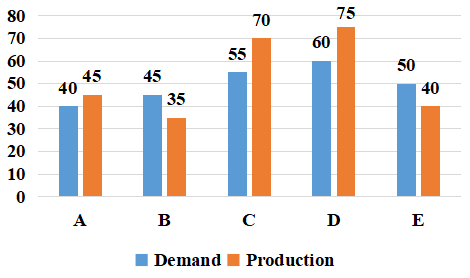
What is the ratio of total production of motor cycles of companies A, B, C, D and E, to that of the total demand of motorcycles of all the companies during the five years?
Create a FREE account and get:
- Free SSC Study Material - 18000 Questions
- 230+ SSC previous papers with solutions PDF
- 100+ SSC Online Tests for Free


