Instructions
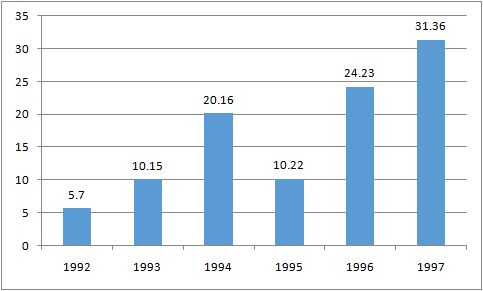
Study the Bar diagram carefully and answer the questions. The Bar diagram shows the trends of foreign direct investment (FDI) into India from all over the World (in Rs. crores).
Question 73
The year which exhibited the 2nd highest growth percentage in FDI in India over the period shown is
Solution
Increase in the year 1993 from the previous year = $$\frac{4.45}{5.7}\times100$$ = 78.07%
Increase in the year 1994 from the previous year = $$\frac{10.01}{10.15}\times100$$ = 98.62%
There is a decrease in the year 1995 from the previous year.
Increase in the year 1996 from the previous year = $$\frac{14.01}{10.22}\times100$$ = 137.4%
Increase in the year 1997 from the previous year = $$\frac{7.13}{24.23}\times100$$ = 29.4%
=> Ans - (B)
Get AI Help
Create a FREE account and get:
- Free SSC Study Material - 18000 Questions
- 230+ SSC previous papers with solutions PDF
- 100+ SSC Online Tests for Free


