Question 73
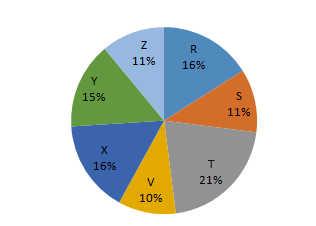
The following pie chart shows proportion of population of seven villages in 2009. Study the pie chart and answer the questions that follows :

Create a FREE account and get:
- Free SSC Study Material - 18000 Questions
- 230+ SSC previous papers with solutions PDF
- 100+ SSC Online Tests for Free

