Sign in
Please select an account to continue using cracku.in
↓ →
Join Our JEE Preparation Group
Prep with like-minded aspirants; Get access to free daily tests and study material.
Consider the given graph showing variation of reactant concentration with time. Three different reactions were started with identical initial concentration of reactants. Which of the following statement is correct?
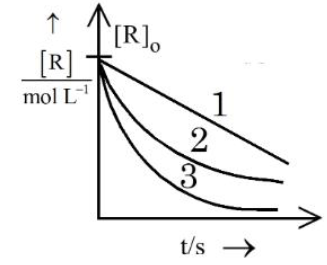
The graph in the question is a plot of reactant concentration $$[R]$$ (vertical axis) versus time $$t$$ (horizontal axis) for three different reactions labelled 1, 2 and 3. By looking only at the way $$[R]$$ falls with time we can decide the order of each reaction as follows:
Step 1 : Identifying reaction orders from the shape of the $$[R]$$-time curve
• For a zero-order reaction the integrated rate law is $$[R]=[R]_0-k\,t$$.
Hence $$[R]$$ decreases linearly with time and the graph is a straight line having constant (negative) slope until the reactant is exhausted.
• For a first-order reaction the integrated rate law is $$\ln [R]=\ln [R]_0-k\,t$$.
Consequently $$[R]$$ itself falls exponentially, giving a gently curved graph that never becomes straight.
• For a second-order reaction (with rate $$=k[R]^2$$) the integrated form is $$\dfrac{1}{[R]}=\dfrac{1}{[R]_0}+k\,t$$.
Hence $$[R]$$ versus $$t$$ shows a steeper downward curvature than the first-order case.
On the graph given in the question:
• Reaction 1 is represented by a perfect straight line - therefore it must be zero order.
• Reactions 2 and 3 are both curved, so they cannot be zero order. From their relative curvatures, one of them is first order and the other second order, but they are definitely not identical.
Step 2 : Verifying each statement in the options
Option A “All reactions are of the same order” - Wrong, because reaction 1 is zero-order while 2 and 3 are not.
Option B “$$k_3 \gt k_2$$ if the reactions are of the same order” - The premise is false (they are not of the same order); therefore this comparative statement about rate constants has no meaning here and is rejected.
Option C “The unit of $$k_1$$ is s$$^{-1}$$” - The unit s$$^{-1}$$ corresponds to a first-order rate constant. Since we have already seen that reaction 2 is not guaranteed to be first order (its curvature could belong to a second-order process), this statement is not necessarily true; the graph alone is insufficient to confirm a first-order unit.
Option D “Decomposition of HI on gold surface is an example of reaction 2” - The surface-catalysed decomposition of hydrogen iodide, $$2\,HI(g) \rightarrow H_2(g)+I_2(g)$$ on a gold surface, proceeds with a constant rate independent of $$[HI]$$ as long as the surface is covered by adsorbed molecules. Hence Option D is correct.
Conclusion
Only Option D matches the information conveyed by the graph.
Final answer: Option D which is: Decomposition of HI on gold surface is an example of reaction 2
Create a FREE account and get:


Educational materials for JEE preparation

Ask our AI anything

AI can make mistakes. Please verify important information.
AI can make mistakes. Please verify important information.


