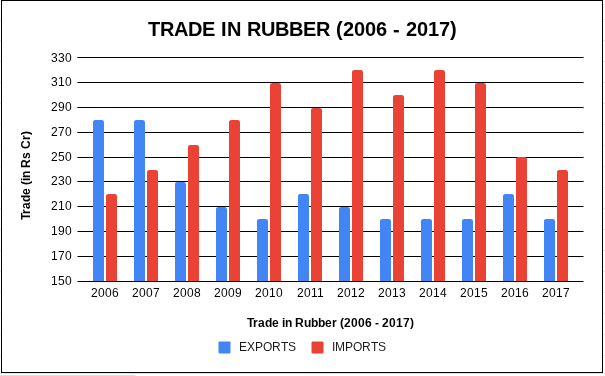
Analyse the given data for exports and imports of rubber in Rs. crores from 2006 to 2017 and answer the questions based on the analysis.

Balance of trade is defined as imports subtracted from exports ( = exports - imports). Which of the following blocks of three years has witnessed the largest average negative balance of trade?
Solution
2007-2009
2007: 280 - 240 = 40
2008: 230 - 260 = -30
2009: 210 - 280 = -70
Average = (40 - 30 - 70)/3 = -20
2015 - 2017
2015: 200 - 310 = -110
2016: 220 - 250 = -30
2017: 200 - 240 = -40
Average = (-30 - 40 - 110)/2 = -60
2014 - 2016
2014: 200 - 320 = -120
2015: 200 - 310 = -110
2016: 220 - 250 = -30
Average = (-120 - 110 - 30)/3 = -86.67
2010 - 2012
2010: 200 - 310 = -110
2011: 220 - 290 = -70
2012: 210 - 320 = -110
Average = (-110 - 70 - 110)/3 = -96.67
Largest average negative balance of trade = -96.67, for the year 2010 - 2012.
Create a FREE account and get:
- Download Maths Shortcuts PDF
- Get 300+ previous papers with solutions PDF
- 500+ Online Tests for Free

