Instructions
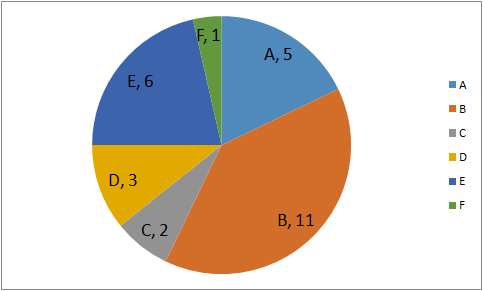
The pie chart shows tickets sold (in 1000 s) per month by six different airlines (A, B, C, D, E, F. Study the diagram and answer the following questions.
Solution
Number of tickets sold by Airline E (in thousands) = 6
Number of tickets sold by Airline A (in thousands) = 5
=> Required % = $$\frac{6-5}{5}\times 100$$
= $$\frac{100}{5}=20\%$$
=> Ans - (C)
Get AI Help
Create a FREE account and get:
- Free SSC Study Material - 18000 Questions
- 230+ SSC previous papers with solutions PDF
- 100+ SSC Online Tests for Free


