Question 44
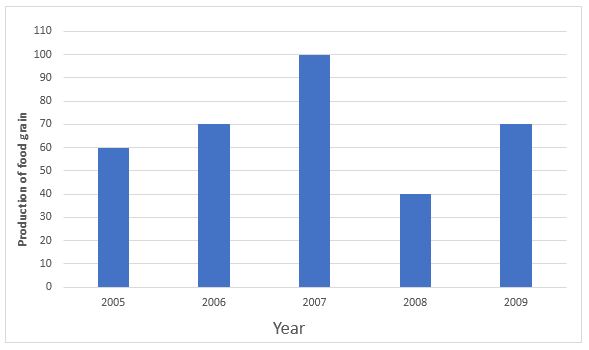
Study the above bar graph showing the production of food grains (in million tons). What is the ratio between the maximum production and the minimum production during the given period ?
Graph should be drawn
Solution
Clearly ,in the year 2007 , maximum production of 100 mil tonnes is observed.
While in the year 2008 , minimum production of 40 mil tonnes is observed.
Hence , the ratio is 100:40 = 5:2
Get AI Help
Create a FREE account and get:
- Free SSC Study Material - 18000 Questions
- 230+ SSC previous papers with solutions PDF
- 100+ SSC Online Tests for Free


