The table given below provides the details of monthly sales (in lakhs of rupees) and the value of products returned by the customers (as a percentage of sales) of an e-commerce company for three product categories for the year 2024. Net sales (in lakhs of rupees) is defined as the difference between sales (in lakhs of rupees) and the value of products returned (in lakhs of rupees).
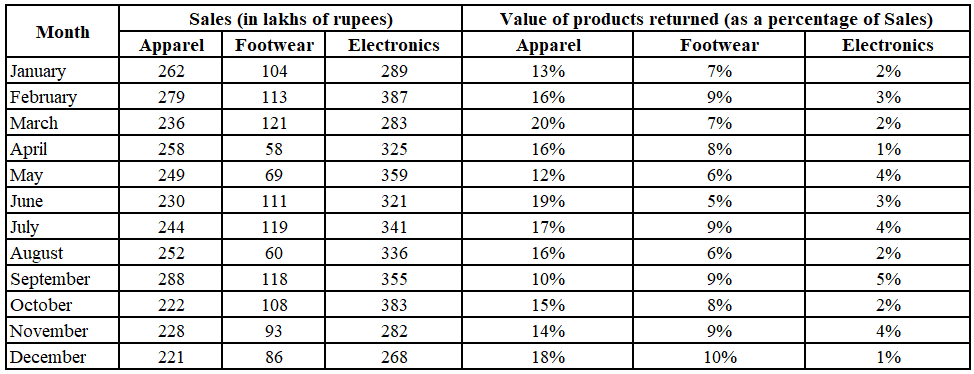
Among the following four months, for which month the contribution of the Apparel category in the total monthly sales was the highest?
Solution
In January, the contribution of the Apparel category = $$\dfrac{262}{262+104+289}=\dfrac{262}{655}=40\%$$
In April, the contribution of the Apparel category = $$\dfrac{258}{258+58+325}=\dfrac{258}{641}=40.25\%$$
In December, the contribution of the Apparel category = $$\dfrac{221}{221+86+268}=\dfrac{221}{575}=38.43\%$$
In August, the contribution of the Apparel category = $$\dfrac{252}{252+60+336}=\dfrac{252}{648}=38.89\%$$
So, for April the contribution is highest.
Create a FREE account and get:
- Download Maths Shortcuts PDF
- Get 300+ previous papers with solutions PDF
- 500+ Online Tests for Free