Sign in
Please select an account to continue using cracku.in
↓ →
Join Our JEE Preparation Group
Prep with like-minded aspirants; Get access to free daily tests and study material.
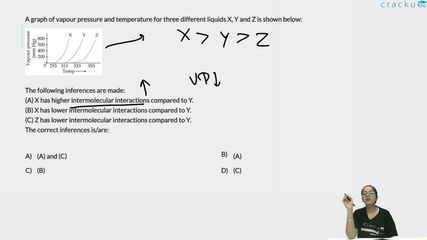
A graph of vapour pressure and temperature for three different liquids X, Y and Z is shown below:
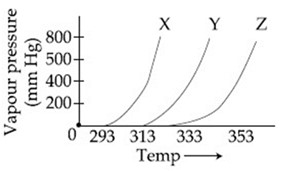
The following inferences are made:
(A) X has higher intermolecular interactions compared to Y.
(B) X has lower intermolecular interactions compared to Y.
(C) Z has lower intermolecular interactions compared to Y.
The correct inferences is/are:
The vapor pressure of a liquid is determined by the kinetic energy of its molecules and the strength of the attractive forces holding them together in the liquid phase:
Therefore, at any fixed temperature point, the relationship is inversely proportional:
$$\text{Vapor Pressure} \propto \frac{1}{\text{Strength of Intermolecular Forces}}$$
If we draw a vertical line at a constant temperature (for example, at $$313\text{ K}$$ or $$333\text{ K}$$), we can compare the vapor pressures of the three liquids directly:
$$\text{Vapor Pressure Order at constant } T: \quad P_X > P_Y > P_Z$$
Applying our inverse relationship rule, we can deduce the true relative strength of their intermolecular interactions:
$$\text{Intermolecular Interactions Strength Order:} \quad \mathbf{Z > Y > X}$$
Only statement (B) accurately describes the trend shown in the vapor pressure curves.
Answer: Option C — (B)
Click on the Email ☝️ to Watch the Video Solution
Create a FREE account and get:


Educational materials for JEE preparation

Ask our AI anything

AI can make mistakes. Please verify important information.
AI can make mistakes. Please verify important information.
