Sign in
Please select an account to continue using cracku.in
↓ →
Join Our JEE Preparation Group
Prep with like-minded aspirants; Get access to free daily tests and study material.
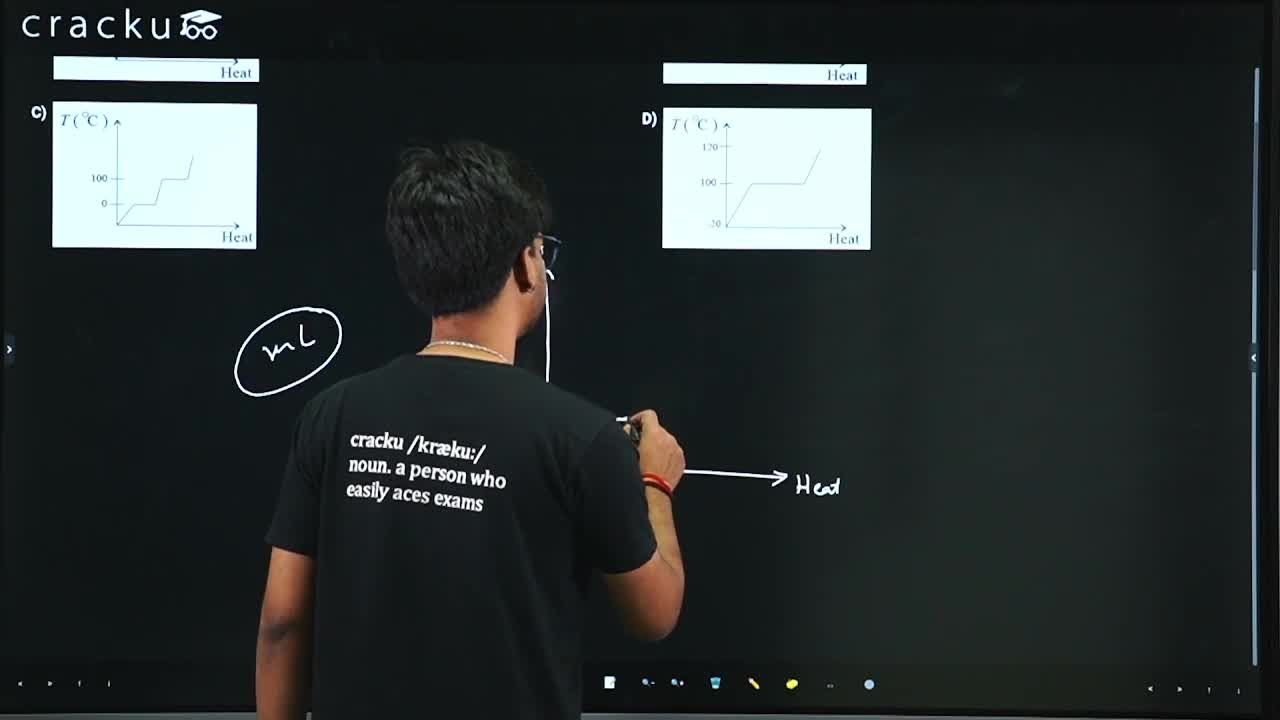
Which of the following best represents the temperature versus heat supplied graph for water, in the range of - 20 °C to 120 °C ?
The heating process for water from $$-20^\circ\text{C}$$ to $$120^\circ\text{C}$$ involves three distinct states of matter and two phase transitions.
1. Heating Ice ($$-20^\circ\text{C}$$ to $$0^\circ\text{C}$$)
Heat is initially supplied to raise the temperature of solid ice. The relationship is linear: $$Q = m \cdot s_{ice} \cdot \Delta T$$
Since the specific heat of ice $$s_{ice}$$ is approximately $$0.5 \text{ cal/g}^\circ\text{C}$$, the temperature rises with a relatively steep slope ($$\frac{dT}{dQ} = \frac{1}{ms}$$).
2. Melting Phase Change (at $$0^\circ\text{C}$$)
When the ice reaches its melting point, the temperature remains constant while the state changes from solid to liquid. This is represented by a horizontal plateau: $$Q = m \cdot L_f$$
Here, $$L_f = 80 \text{ cal/g}$$ is the latent heat of fusion.
3. Heating Liquid Water ($$0^\circ\text{C}$$ to $$100^\circ\text{C}$$)
After all ice has melted, the temperature of the liquid water rises: $$Q = m \cdot s_{water} \cdot \Delta T$$
The specific heat of water $$s_{water}$$ is $$1.0 \text{ cal/g}^\circ\text{C}$$. This section has a lower slope than the ice section because more heat is required to raise the temperature by one degree.
4. Boiling Phase Change (at $$100^\circ\text{C}$$)
At the boiling point, the temperature again remains constant during vaporization, creating a second horizontal plateau: $$Q = m \cdot L_v$$
Because the latent heat of vaporization ($$L_v = 540 \text{ cal/g}$$) is significantly higher than the latent heat of fusion, this plateau is much longer than the one at $$0^\circ\text{C}$$.
Graph (C) is the only representation that correctly shows:
The starting point below the origin ($$-20^\circ\text{C}$$).
Both phase change plateaus at $$0^\circ\text{C}$$ and $$100^\circ\text{C}$$.
A longer second plateau to account for the higher energy required for vaporization.
Hence, option (C) is correct.
Click on the Email ☝️ to Watch the Video Solution
Create a FREE account and get:


Educational materials for JEE preparation

Ask our AI anything

AI can make mistakes. Please verify important information.
AI can make mistakes. Please verify important information.
