Sign in
Please select an account to continue using cracku.in
↓ →
Join Our JEE Preparation Group
Prep with like-minded aspirants; Get access to free daily tests and study material.
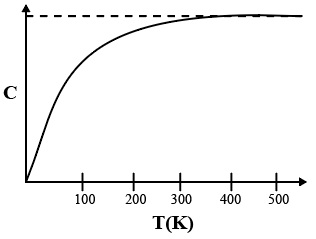
The figure below shows the variation of specific heat capacity (C) of a solid as a function of temperature (T). The temperature is increased continuously from 0 to 500 K at a constant rate. Ignoring any volume change, the following statement(s)is (are) correct to a reasonable approximation.
Create a FREE account and get:


Educational materials for JEE preparation

Ask our AI anything

AI can make mistakes. Please verify important information.
AI can make mistakes. Please verify important information.
