Sign in
Please select an account to continue using cracku.in
↓ →
Join Our JEE Preparation Group
Prep with like-minded aspirants; Get access to free daily tests and study material.
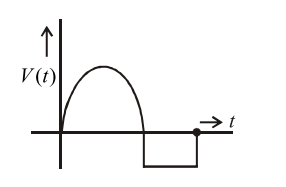
Two coils, X and Y, are kept in close vicinity of each other. When a varying current, $$I(t)$$, flows through coil X, the induced emf $$(V(t))$$ in coil Y, varies in the manner shown here. The variation of $$I(t)$$, with time, can then be represented by the graph labelled as graph :
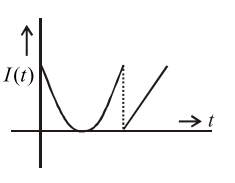
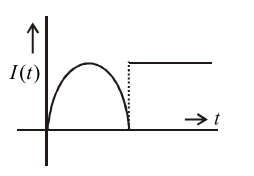
(A)
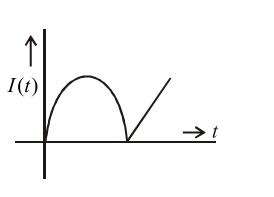
(B)
(c)
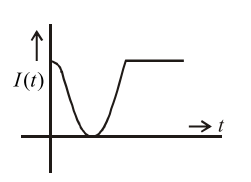
(D)
The induced emf $$V(t)$$ in coil Y is related to the rate of change of current $$I(t)$$ in coil X by $$V(t) = -M \frac{dI(t)}{dt}$$, where $$M$$ is the mutual inductance between the two coils. This implies that the slope of the $$I(t)$$ vs $$t$$ graph is proportional to $$-V(t)$$.
In the first part of the graph, $$V(t)$$ is positive. Since $$\frac{dI(t)}{dt} = -\frac{V(t)}{M}$$, a positive $$V(t)$$ corresponds to a negative slope in the $$I(t)$$ graph. At the end of this interval, $$V(t) = 0$$, which means the slope of the $$I(t)$$ graph must become zero (the curve reaches a local minimum).
In the second part of the graph, $$V(t)$$ is a constant negative value. $$\frac{dI(t)}{dt} = -\frac{(-\text{constant})}{M} = \text{positive constant}$$
A constant positive slope indicates that $$I(t)$$ must be a straight line inclined at an acute angle to the time axis.
Graph (A) correctly represents this.
Create a FREE account and get:


Educational materials for JEE preparation

Ask our AI anything

AI can make mistakes. Please verify important information.
AI can make mistakes. Please verify important information.
