Instructions
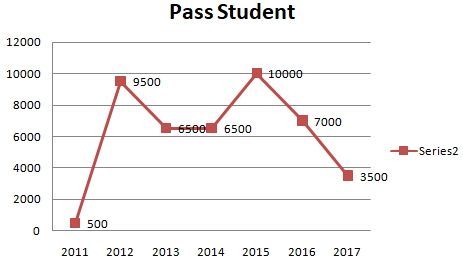
The line graph shows the number of students of a certain university who passed in the given year in their final exams. Study the diagram and answer the following questions.
Year
Question 17
In which year were number of students who passed were more than those who passed in the previous year?
Solution
In 2012 and 2015, number of students who passed were more than those who passed in the previous year.
=> Ans - (B)
Get AI Help
Create a FREE account and get:
- Free SSC Study Material - 18000 Questions
- 230+ SSC previous papers with solutions PDF
- 100+ SSC Online Tests for Free


