Instructions
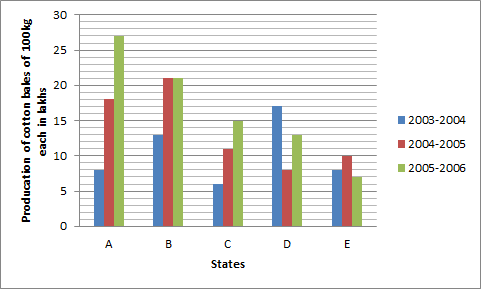
Directions : The following graph shows the production of cotton bales of 100 kg each in lakhs by different states A, B, C, D and E over the years. Study the graph and answer the following Questions.
Question 150
The number of States for which the production of cotton in 2005-2006 is less than or equal to the preceding year is
Solution
In B, production is same as its previous year whether in C , it is decreased.
Get AI Help
Video Solution

Click on the Email ☝️ to Watch the Video Solution
Create a FREE account and get:
- Free SSC Study Material - 18000 Questions
- 230+ SSC previous papers with solutions PDF
- 100+ SSC Online Tests for Free


