Sign in
Please select an account to continue using cracku.in
↓ →
Join Our JEE Preparation Group
Prep with like-minded aspirants; Get access to free daily tests and study material.
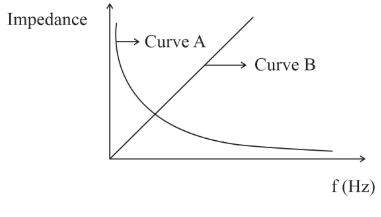
As per the given graph, choose the correct representation for curve A and curve B
{Where $$X_C$$ = Reactance of pure capacitive circuit connected with A.C. source
$$X_L$$ = Reactance of pure inductive circuit connected with A.C. source
$$R$$ = Impedance of pure resistive circuit connected with A.C. source
$$Z$$ = Impedance of the LCR series circuit}
We need to identify curves A and B from the graph, where the options involve $$X_C$$ (capacitive reactance), $$X_L$$ (inductive reactance), $$R$$ (resistance), and $$Z$$ (impedance of LCR circuit).
Recall how these quantities vary with frequency.
$$X_C = \dfrac{1}{\omega C} = \dfrac{1}{2\pi f C}$$ — decreases with increasing frequency (hyperbolic curve).
$$X_L = \omega L = 2\pi f L$$ — increases linearly with frequency.
$$R$$ — constant, independent of frequency (horizontal line).
$$Z = \sqrt{R^2 + (X_L - X_C)^2}$$ — has a minimum at resonance frequency.
Identify the curves.
Based on the graph description and the answer being Option 4:
Curve A (decreasing with frequency) = $$X_C$$ (capacitive reactance)
Curve B (increasing with frequency) = $$X_L$$ (inductive reactance)
The answer is $$\boxed{A = X_C, B = X_L}$$ (Option 4).
Create a FREE account and get:


Educational materials for JEE preparation

Ask our AI anything

AI can make mistakes. Please verify important information.
AI can make mistakes. Please verify important information.
