Study the chart carefully and answer the questions.
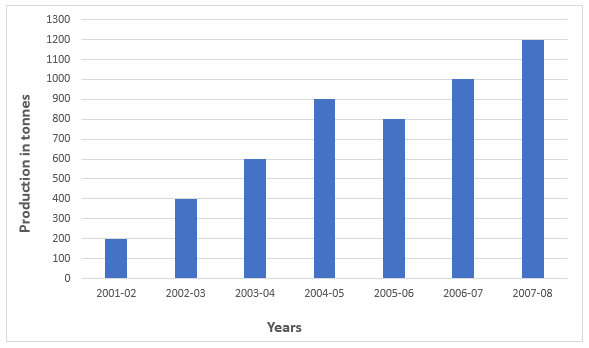
The chart shows production of an item (in tonnes) during certain years
The year in which production increased the lowest as compared to the previous year is
Solution
Production in the year :
2001-02 = 200
2002-03 = 400
2003-04 = 600
2004-05 = 900
2005-06 = 800
2006-07 = 1000
2007-08 = 1200
=> % increase in 2002-03 as compared to previous year = $$\frac{400-200}{200}$$ * 100
= 100%
=> % increase in 2003-04 as compared to previous year = $$\frac{600-400}{400}$$ * 100
= 50%
=> % increase in 2004-05 as compared to previous year = $$\frac{900-600}{600}$$ * 100
= 50%
=> In 2005-06, there is no % increase as compared to previous year.
=> % increase in 2006-07 as compared to previous year = $$\frac{1000-800}{800}$$ * 100
= 25%
=> % increase in 2007-08 as compared to previous year = $$\frac{1200-1000}{1000}$$ * 100
= 20% [MIN]
Thus, % increase is lowest in 2007-08 as compared to previous year
Get AI Help
Create a FREE account and get:
- Free SSC Study Material - 18000 Questions
- 230+ SSC previous papers with solutions PDF
- 100+ SSC Online Tests for Free


