Instructions
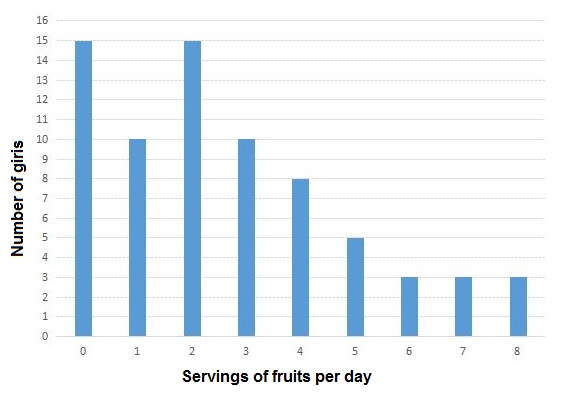
The distribution of fruit consumption in a sample of 72 seventeen – year – old girls is given in the graph below. Study the graph and answer the questions.
Distribution of fruit consumption
Solution
No. of girls who ate fewer than 2 servings a day = (No. of girls who ate 0) + (No. of girls who ate 1)
= 15 + 10 = 25
Get AI Help
Create a FREE account and get:
- Free SSC Study Material - 18000 Questions
- 230+ SSC previous papers with solutions PDF
- 100+ SSC Online Tests for Free


