Instructions

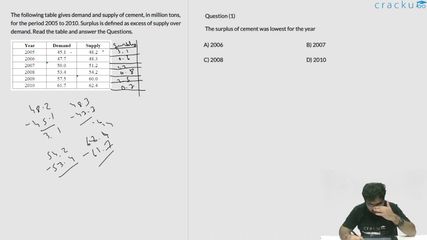
The following table gives demand and supply of cement, in million tons, for the period 2005 to 2010. Surplus is defined as excess of supply over demand. Read the table and answer the Questions.
Solution
Surplus = Supply - Demand.
Surplus in,
2005 = 3.1
2006 = 0.6
2007 = 1.2
2008 = 0.8
2009 = 2.5
2010 = 0.7
The surplus is minimum for the year 2006.
Get AI Help
Video Solution
Click on the Email ☝️ to Watch the Video Solution

SRCC Quant Questions | SRCC Quantitative Ability
SRCC DILR Questions | LRDI Questions For SRCC
SRCC Verbal Ability Questions | VARC Questions For SRCC
Free SRCC DILR Questions
Book Free CAT Mentorship
Get personalized CAT strategy from a 99%iler
500+ students mentored
OTP Verification
Enter the 6-digit code sent to your phone
Booking Summary
Session:Free CAT Mentorship
Phone:
Date:
Time:
Enter OTP
Didn't receive the OTP?


