Sign in
Please select an account to continue using cracku.in
↓ →
Join Our JEE Preparation Group
Prep with like-minded aspirants; Get access to free daily tests and study material.
For three low density gases $$A$$, $$B$$, $$C$$ pressure versus temperature graphs are plotted while keeping them at constant volume, as shown in the figure.
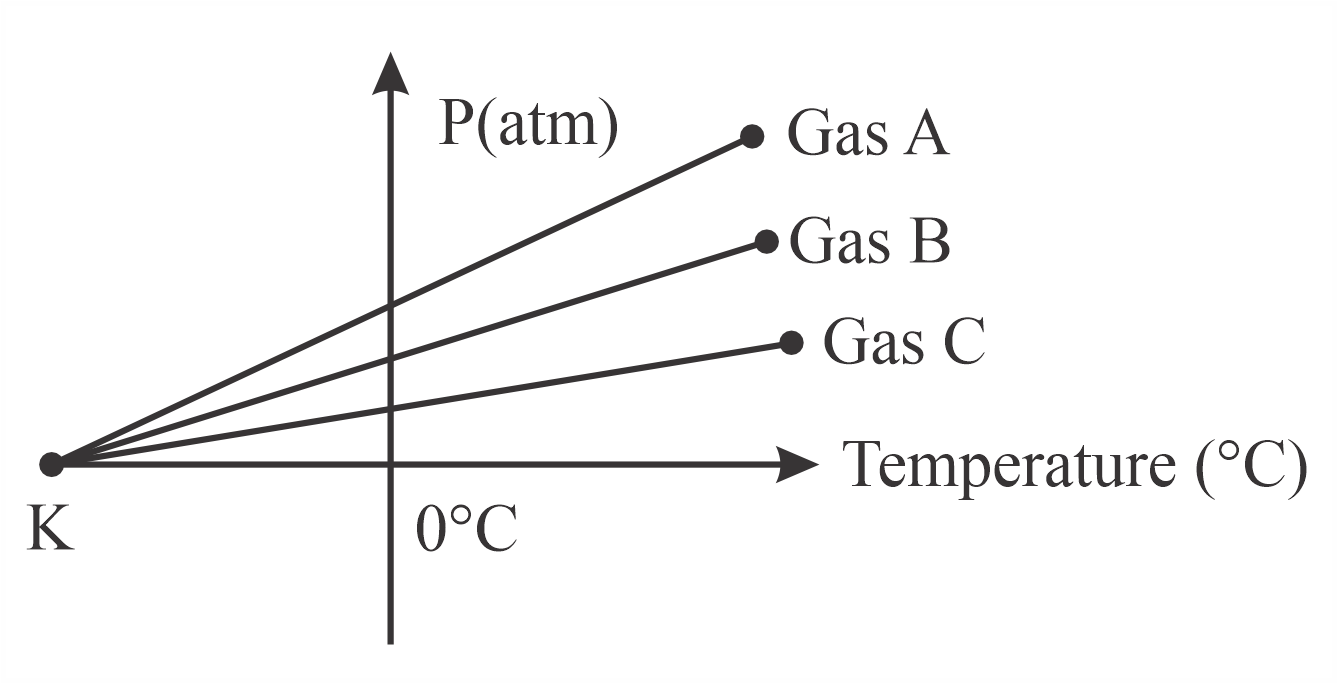
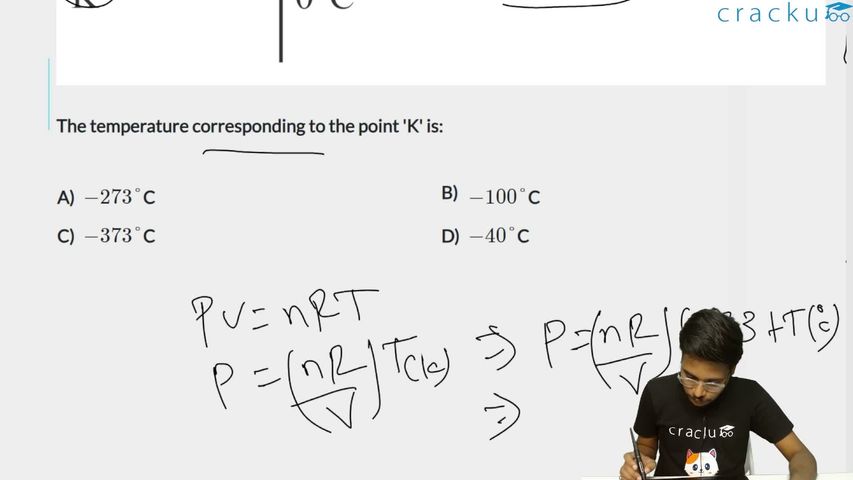
The temperature corresponding to the point 'K' is:
Three low density gases A, B, C have their pressure plotted against temperature (in degree C) at constant volume. All lines converge at point K when extrapolated.
We start by noting that
For an ideal gas at constant volume $$V$$, with $$n$$ moles:
$$ P = \frac{nR}{V} T_{\text{abs}} $$
where $$T_{\text{abs}}$$ is the absolute temperature in Kelvin.
Next,
Since $$T_{\text{abs}} = T(°C) + 273$$:
$$ P = \frac{nR}{V}(T + 273) $$
This is a linear equation in $$T$$ (Celsius). Different gases have different slopes ($$nR/V$$), but all lines have the same x-intercept (where $$P = 0$$).
From this,
Setting $$P = 0$$:
$$ 0 = \frac{nR}{V}(T + 273) $$
$$ T + 273 = 0 \implies T = -273°C $$
This is absolute zero -- the temperature at which an ideal gas would theoretically have zero pressure. All gas lines, regardless of the type or amount of gas, converge to this point when extrapolated.
The temperature corresponding to point K is $$-273°$$C.
The correct answer is Option 1: $$-273°$$C.
Click on the Email ☝️ to Watch the Video Solution
Create a FREE account and get:


Educational materials for JEE preparation

Ask our AI anything

AI can make mistakes. Please verify important information.
AI can make mistakes. Please verify important information.
