Sign in
Please select an account to continue using cracku.in
↓ →
Join Our JEE Preparation Group
Prep with like-minded aspirants; Get access to free daily tests and study material.
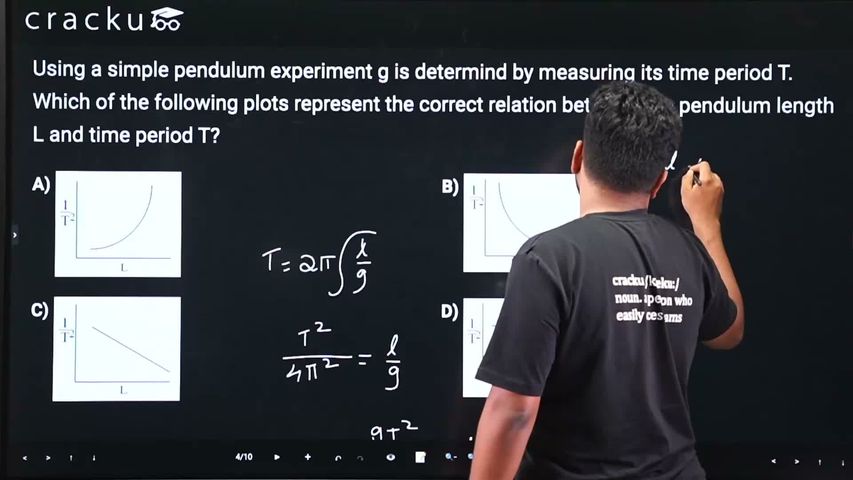
Using a simple pendulum experiment g is determind by measuring its time period T. Which of the following plots represent the correct relation between the pendulum length L and time period T?
From simple pendulum relation
$$T=2\pi\sqrt{\frac{L}{g}}$$
Squaring,
$$T^2=\frac{4\pi^2L}{g}$$
Rearrange:
$$\frac{1}{T^2}=\frac{g}{4\pi^2L}$$
So
$$\frac{1}{T^2}\propto\frac{1}{L}$$
or equivalently
$$L=\frac{g}{4\pi^2}\cdot\frac{1}{(1/T^2)}$$
Thus L is inversely proportional to $$\frac{1}{T^2}$$
So graph of $$L$$ versus $$1/T^2$$ is a rectangular hyperbola.
Click on the Email ☝️ to Watch the Video Solution
Create a FREE account and get:


Educational materials for JEE preparation

Ask our AI anything

AI can make mistakes. Please verify important information.
AI can make mistakes. Please verify important information.
