Sign in
Please select an account to continue using cracku.in
↓ →
Join Our JEE Preparation Group
Prep with like-minded aspirants; Get access to free daily tests and study material.
From the $$v - t$$ graph shown, the ratio of distance to displacement in 25 s of motion is:
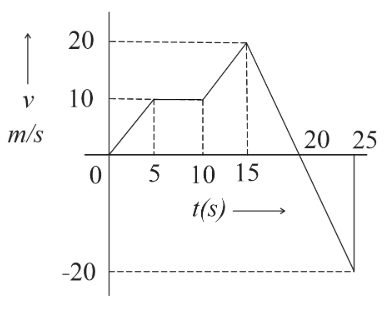
The shaded region under a $$v\!-\!t$$ graph always gives displacement when the sign (above / below the time-axis) is taken into account and gives distance when only the magnitude of the area is added.
From the given graph it is seen that:
• For the first $$20\ \text{s}$$ the velocity is constant and positive (the horizontal line at height $$v_0$$).
Area (rectangle) $$A_1 = v_0 \times 20$$
• For the next $$5\ \text{s}$$ (from $$t = 20\ \text{s}$$ to $$t = 25\ \text{s}$$) the velocity is the same in magnitude but negative (the horizontal line at depth $$-v_0$$).
Area (rectangle) $$A_2 = (-\,v_0) \times 5$$
Distance travelled in 25 s
Add magnitudes of both areas:$$|A_1| + |A_2| = v_0(20) + v_0(5) = 25\,v_0$$
Displacement in 25 s
Add the signed areas:$$A_1 + A_2 = v_0(20) + (-v_0)(5) = v_0(20 - 5) = 15\,v_0$$
Required ratio
$$\text{distance} \; : \; \text{displacement} = \frac{25\,v_0}{15\,v_0} = \frac{5}{3}$$
Hence the ratio of distance to displacement in the first $$25\ \text{s}$$ of motion is $$\frac{5}{3}$$.
Option C is correct.
Click on the Email ☝️ to Watch the Video Solution
Create a FREE account and get:


Educational materials for JEE preparation

Ask our AI anything

AI can make mistakes. Please verify important information.
AI can make mistakes. Please verify important information.
