Sign in
Please select an account to continue using cracku.in
↓ →
Join Our JEE Preparation Group
Prep with like-minded aspirants; Get access to free daily tests and study material.
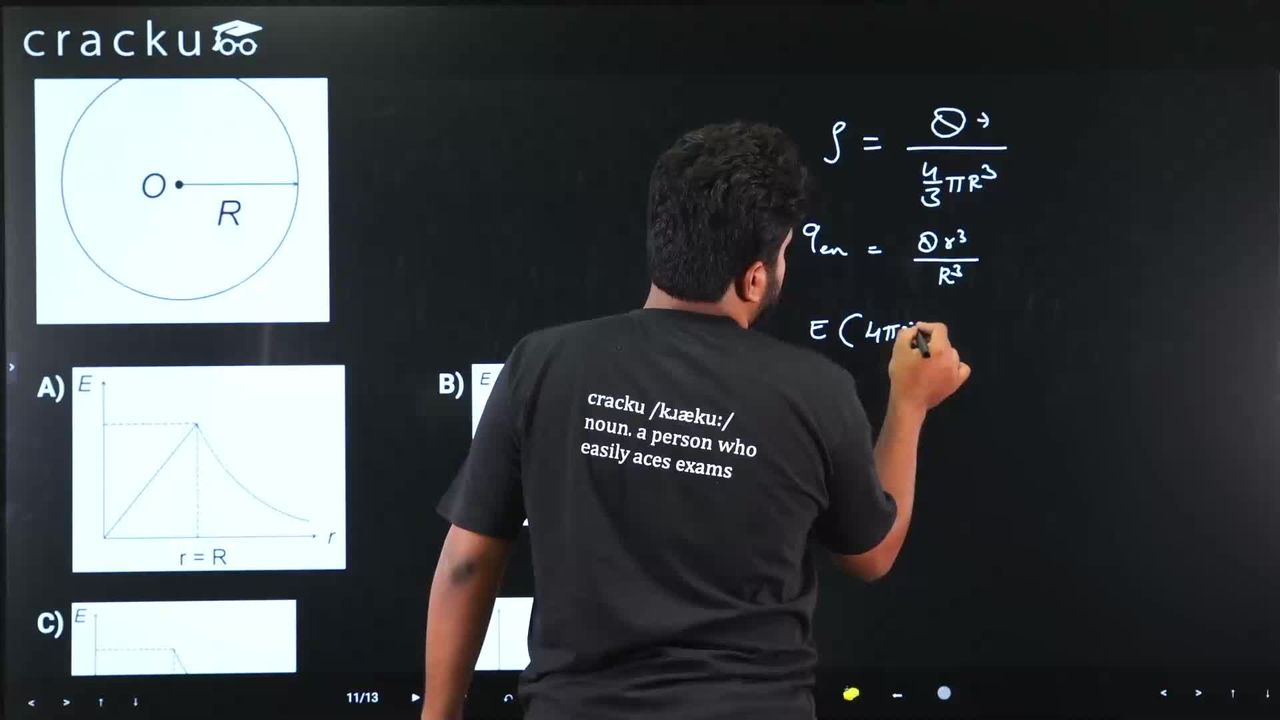
Graphical variation of electric field due to a uniformly charged insulating solid sphere of radius R, with distance r from the centre O is represented by:

For a uniformly charged insulating solid sphere of radius RRR, the electric field varies with distance rrr from the center as follows
$$Inside\ the\ sphere\ (r\le R)$$
Using Gauss law:
Charge enclosed within radius r,
$$q_{\text{enc}}=\rho\frac{4}{3}\pi r^3$$
where
$$\rho=\frac{Q}{\frac{4}{3}\pi R^3}$$
Using Gauss law,
$$E(4\pi r^2)=\frac{q_{\text{enc}}}{\varepsilon_0}$$
Substituting,
$$E=\frac{Qr}{4\pi\varepsilon_0R^3}$$
Thus,
$$E\propto r$$
So electric field increases linearly from zero at the center to a maximum at the surface.
At
$$r=R$$
$$E_{\max}=\frac{Q}{4\pi\varepsilon_0R^2}$$
$$Outside\ the\ sphere(r>R)$$
Entire charge acts as if concentrated at the center:
$$E=\frac{Q}{4\pi\varepsilon_0r^2}$$
Thus,
$$E\propto\frac{1}{r^2}$$
So electric field decreases inversely as square of distance.
So the graph starts from origin, rises linearly, then falls as a hyperbola-like curve.
Click on the Email ☝️ to Watch the Video Solution
Create a FREE account and get:


Educational materials for JEE preparation

Ask our AI anything

AI can make mistakes. Please verify important information.
AI can make mistakes. Please verify important information.
