SSC CGL Mathematics Test 57
Instructions
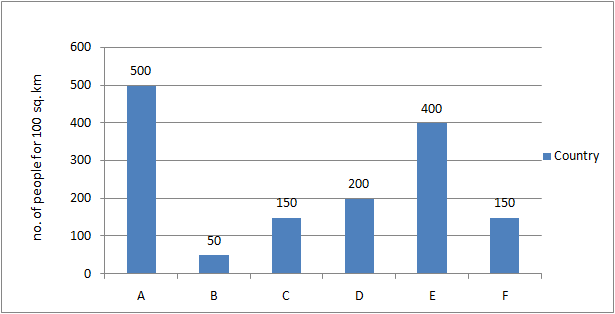
The bar graph shows the population density of 6 countries. Study the diagram and answer the following questions.
Q 1
If area of country B is 20,00,000 sq km, what is its population?
Q 2
What is the ratio of the population densities of country C to country D?
Q 3
What is the difference in the average number of people living per 1,000 sq km in countries E and F?
Q 4
Population density of country E is greater than population density of country D by:
Instructions
For the following questions answer them individually
Q 5
The simplest value of $$\frac{3\sqrt{8}-2\sqrt{12}+\sqrt{20}}{3\sqrt{18}-2\sqrt{27}+\sqrt{45}}$$ is
Leaderboard
| # | Name | Overall Score |
|---|---|---|
| 1 | Stephen | 5 |
| 2 | devender meena | 5 |
| 3 | sai himaja | 5 |
| 4 | Bulti | 5 |
| 5 | Varun Parashar | 5 |
| 6 | Sarika Evangeline | 5 |
| 7 | Nikhil Sharma Vats | 5 |
| 8 | Pradeep Jha | 5 |
| 9 | Aditya Gupta | 5 |
| 10 | dhanjee patel | 5 |
