Sign in
Please select an account to continue using cracku.in
↓ →
Join Our IPMAT Preparation Group
Prep with like-minded aspirants; Get access to free daily tests and study material.
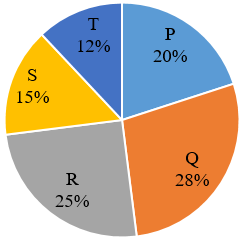
The state of Panchagarh has 5 cities, whose population contributions are shown in the pie chart below
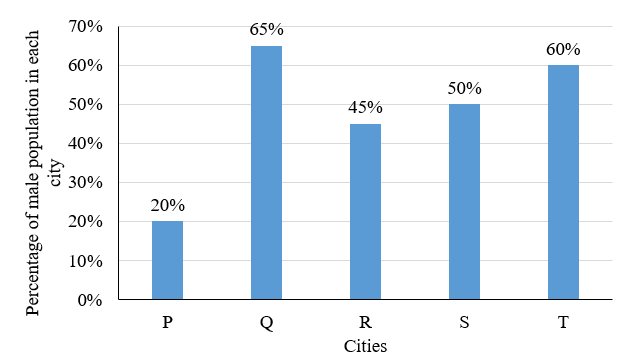
The bar graph below shows the percentage of males in each city of Panchagarh in 2016. These percentages do not chnage over time
Assume the population of Panchagarh in 2016 was 1.5 lakh. In 2017, the population of city P increased by 15%, while that of city S increased by 20%. What is the ratio of the male population of city P to that of city S in 2017?
Given,
Total population in 2016 = 150000
Population of P in 2016 = $$\ \ \ \ \ \dfrac{\ 20}{100}\times\ 150000\ =30000$$
Population of P in 2017 = $$\ \ \ \ \ \dfrac{\ 115}{100}\times\ 30000\ =34500$$
Male Population of P in 2017 = $$\ \ \ \ \ \dfrac{\ 20}{100}\times\ 34500\ =6900$$
Population of S in 2016 = $$\ \ \ \ \ \dfrac{\ 15}{100}\times\ 150000\ =22500$$
Population of S in 2017 = $$\ \ \ \ \ \dfrac{\ 120}{100}\times\ 22500\ =27000$$
Male Population of S in 2017 = $$\ \ \ \ \ \dfrac{\ 50}{100}\times\ 27000\ =13500$$
Ratio of the male population of city P to that of city S in 2017 = $$\ \ \ \ \ \dfrac{\ 6900}{13500}=\ \dfrac{\ 23}{45}$$
Crack IPMAT 2026 with Cracku

Educational materials for IPMAT and IIMB UG preparation

Ask our AI anything

AI can make mistakes. Please verify important information.
AI can make mistakes. Please verify important information.