Sign in
Please select an account to continue using cracku.in
↓ →
Join Our JEE Preparation Group
Prep with like-minded aspirants; Get access to free daily tests and study material.
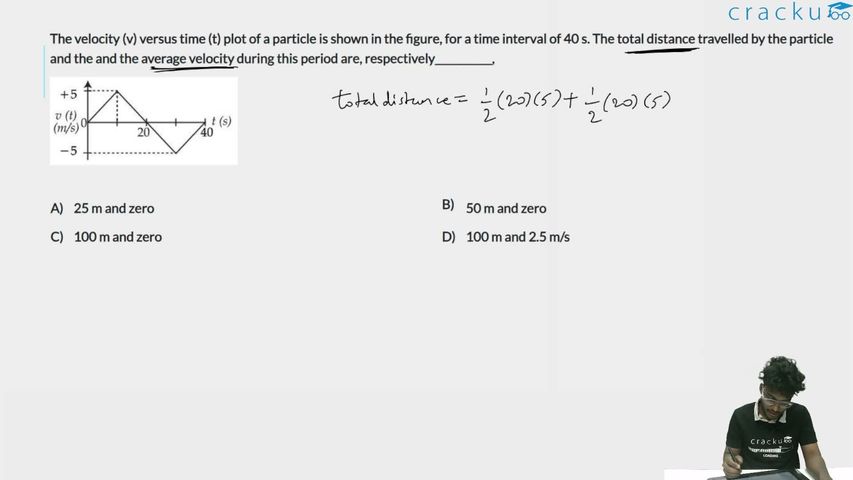
The velocity (v) versus time (t) plot of a particle is shown in the figure, for a time interval of 40 s. The total distance travelled by the particle and the and the average velocity during this period are, respectively___________,
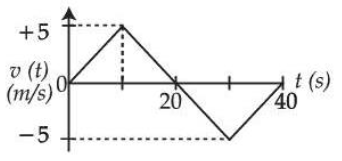
From the velocity-time graph:
Distance travelled is total area under the speed-time graph.
First triangle:
$$\text{Area}_1=\frac{1}{2}\times20\times5=50\ \text{m}$$
Second triangle (take magnitude):
$$\text{Area}_2=\frac{1}{2}\times20\times5=50\ \text{m}$$
Total distance:
$$50+50=100\ \text{m}$$
Net displacement:
$$50-50=0$$
Average velocity:
$$v_{\text{avg}}=\frac{\text{displacement}}{\text{total time}}$$
$$v_{\text{avg}}=\frac{0}{40}=0\ \text{m/s}$$
Click on the Email ☝️ to Watch the Video Solution
Create a FREE account and get:


Educational materials for JEE preparation

Ask our AI anything

AI can make mistakes. Please verify important information.
AI can make mistakes. Please verify important information.
