Which of the following is ‘’not true’’ about Indo- Malaysian relations
A. Malaysia is in the favour of tripartite talk on Kashmir issue
B. India wants Malaysia to help her in the field of hardwares and infrastructure sectors
C. Malaysia is the biggest producer of the palm oil and India is the biggest consumer.
D. Malaysia does not support the Pakistan’s resolution to condemn India in the Organisation of Islamic Conference.
SBI PO 2001
For the following questions answer them individually
Which of the following is ‘’true’’ about the ‘’Megha Tropiques’’?
A. It is the name of a satellite
B. It is a joint venture of France and India
C. It is the name of the new war plane developed in India.
D. It is a space shuttle India has purchased from Germany
As per the estimates given by the Reserve Bank of India the GDP Growth this year is expected to be in the range of….
Shri A. K. Antony who became the Chief Minister of Kerala belongs to which of the following political parties ?
Which of the following statements is ‘’true’’ about the opening of the defence production for private sector ?
A. Now the defence production is open for 100% private participation
B. Government has also allowed 26% direct foreign investment
C. British defence industry has already purchase 20% stake in three defence production units
Which match refree imposed penalties on six Indian Cricketers during their South African tour in 2001 ?
Which of the following countries refused to accept two shipments of wheat imported from India as the quality of the same was of substandard ?
Which of the following is the largest exporter of steel from India ?
Which of the following countries in the Indian subcontinent has put a ban on import of rice from India ?
The Liberhan Commission is set up to enquire which of the following issues ?
The Kyoto Pact is associated with which of the following ?
The remains of an ancient civilization of 4000 BC were discovered in……..
Which of the following companies has purchased the BALCO which has restarted functioning ?
The royal ethnic Pashtun who took over as the head of the interim Government in Afghanistan in December 2001 is
Slobodan Milosevic who was arrested by the security forces of his country was the ……..
Dr. Montek Singh Ahluwalia is appointed the evaluator of the functioning of a prestigious world body known as …..
Who amongst the following is the Defence Minister of India at present ?
Which of the following countries has decided to lift sanctions of India which were put on it in May 1998 following Pokharan Nuclear Test ?
Immediately before the President rule imposed on Manipur who was the Chief Minister there ?
About 130 people died in a stampede at a football stadium in
Mr. Danis Tito is …...
‘’Vachaspati Puraskar’’ is given for outstanding performance in the field of …...
Late Sudhakarrao Naik was associated with….
What per cent of world’s total mango production comes from India ?
Which of the following statements is ‘’not true’’ about the India’s population ?
Why is Compressed Natural Gas (CNG) considered as eco- friendly ?
The ‘World Environment Day’ is observed on which of the following dates ?
Which of the following films was adjudged as the best film in National Film Award- 2000 held in March 2001 ?
The Kidney stones formed in the human body are basically--
Which of the following is ‘’not’’ considered an Environmental Movement in India ?
What per cent of World’s total forest area, India now represents ?
BAYERN of Munich won which of the following trophies after a gap of 25 years ?
Mr. JUnichiro Koizumi is
Who is the first Chief Minister of a first ever elected government in Uttaranchal ?
Which of the following hit the fastest double test century ?
Which of the following politicians has launched a new political outfit, the Shakti Dal recently ?
According to the latest data India’s Foreign exchange Reserves are
Vikas is the name of
Anil Kumble dismissed who among the following players to claim his 300th wicket in test crickets ?
Under which brand name is, Tata selling its shoes ?
The highest volcano of the world is
The only car model among the following that you would not associate with Maruti Udyog Ltd. is
International Women’s day is celebrated on
Who among the following persons has been crowned the 2002 Fa Femina Miss India---- World ?
Who is the new Prime Minister of Taiwan ?
‘Garuda’ is a mobile phone service provided by
In India, the broad money is represented by
Which one of the following tops the list of 100 most valuable companies of the world?
Solution
Login to view the detailed solution.
According to the Planning Commission, which among the following states is expected to achieve the highest per capita growth during the 10th Plan (2002 - 2007) ?
In which of the following countries the Indian embassy is known as Safarat-e-Hind ?
Rearrange the following five sentences A, B, C, D and E in the proper sequence to form a meaningful paragraph; then answer the questions given below them.
Which of the following should be the THIRD statement after arrangement ?
Solution
Login to view the detailed solution.
Which of the following should be the FOURTH statement after arrangement ?
Solution
Login to view the detailed solution.
Which of the following should be the SECOND statement after arrangement ?
Solution
Login to view the detailed solution.
Which of the following should be the FIRST statement after arrangement ?
Solution
Login to view the detailed solution.
Which of the following should be the FIFTH statement after arrangement ?
Solution
Login to view the detailed solution.
Read each sentence to find out whether there is any error in it. The error, if any, will be in one part of the sentence. If there is no error, the answer is E. (Ignore errors of punctuation, if any).
A disabled child (A)/ has defined as (B)/ one who is unable to (C)/ ensure necessities by himself. (D)/ No error (E)
Solution
Login to view the detailed solution.
Many decision problems (A)/ involve a number of (B)/ objectives, and often (C)/ these objectives conflicts. (D)/ No error (E)
Solution
Login to view the detailed solution.
Various employees, whom (A)/ we met, echoed (B)/ the sentiment expressed (C)/ by the CEO of the company. (D)/ No error (E)
Solution
Login to view the detailed solution.
It is difficult to assume that (A)/ a increase in the number of health institutions (B)/ would automatically enhance (C)/ utilisation of health services (D)/ No error (E)
Solution
Login to view the detailed solution.
The challenge for us (A)/ is to engage with a potential (B)/ customer early so we can (C)/ sell him the entire range. (D)/ No error (E)
Solution
Login to view the detailed solution.
Having said that (A)/ let me further clarify (B)/ that is model may (C)/ not always work. (D)/ No error (E)
Solution
Login to view the detailed solution.
This situation probably (A)/ contributing to a (B)/ greater lack of protection (C)/ for children in the households. (D) No error (E)
Solution
Login to view the detailed solution.
The management of the organisation (A)/ must be willing to pass up (B)/ short-term gains for (C)/ long-term strategic benefit. (D)/ No error (E)
Solution
Login to view the detailed solution.
The amount at the minimum (A)/ payment is determined (B)/ by management and varies (C)/ from firm to firm. (D)/ No error (E)
Solution
Login to view the detailed solution.
Went are the days when (A)/ the leaders barked instructions (B)/ and his minions securried (C/ to carry them out. (D)/ No error (E)
Solution
Login to view the detailed solution.
In the following passage there are blanks, each of which has been numbered. These numbers are printed below the passage and against each, five words are suggested, one of which fits the blank appropriately. Find out the appropriate word in each case.
Organisation ...66… is a very broad subject that appears frequently in recent management studies. Organisations have many ….67… to improve whatever it is that they do. They can reflect on their operations, study their products, ...68… to customers, and encourage ...69… parts of the organisation to share knowledge as well as the results of their ….70… efforts. All firms have these opportunities, although few companies take full ...71… of them Good firms everywhere ….72… their process and ...73… in order to learn from past success as well as ….74.... . They measures and benchmark what they do. They try to get different parts of the organisation to ...75… with one another.
66
67
68
69
70
71
72
73
74
75
In each question below a sentence with four words printed in ‘’bold’’ type is given. These are numbered as A, B, C and D. One of these four boldly printed words may be either ‘’wrongly spelt’’ or ‘’inappropriate’’ in the context of the sentence. Find out the word which is wrongly - spelt or inappropriate, if any. The number of that word is your answer. If all the boldly printed words are correctly spelt and also appropriate in the context of the sentence, mark E, i.e., ‘All Correct’ as your answer.
Enforcement of laws, clean and ‘’efficient’’ (A)/ administration was what British rulers ‘’dispensed’’ (B)/ in India through the Government ‘’machinery’’ (C)/ known as ‘’bureaucreacy’’ (D)/ All correct (E)
Solution
Login to view the detailed solution.
‘’Copyright’’ (A)/ will ‘’subsist’’ (B)/ in any work published within the lifetime of the author ‘’until’’ (C)/ 50 years ‘’following’’ (D)/ his death. All correct (E)
Solution
Login to view the detailed solution.
Computer ‘’surveying’’ (A)/ is ‘’surfacing’’ (B)/ at trade shows, where participants ‘’completing (C)/ surveys while ‘’making’’ (D)/ a visit to a company’s booth. All correct (E)
Solution
Login to view the detailed solution.
The ‘’pricing’’ (A)/ of intellectual property is more ‘’complicated’’ (B)/ than most pricing because today it is ‘’relatingly’’ (C)/ ‘’Inexpensive’’ (D)/ to make copies of most intellectual property. All correct (E)
Solution
Login to view the detailed solution.
‘’Experience’’ (A)/ of ‘’extensive’’ (B)/ travel in parts of the ‘’globe’’ (C)/ further ‘’explored’’ (D)/ her vision. All correct (E)
Solution
Login to view the detailed solution.
Read the following passage carefully and answer the questions given below it. Certain words/phrase are printed in ‘’bold’’ to help you to locate them while answering some of the questions.
Using infant mortality as a key indicator of the status of children, we now begin to have the broad features of a hypothesis as to the cause of the higher or lower mortality rates. One aspect is the ‘’complex’’ of factors involving the ‘’access’’ of mothers to trained personnel and other facilities for children delivery, the nutritional status of pregnant and nursing mothers and the quality of health-care and nourishment which babies receive. The other aspect, indicated by rural-urban differentials, is the possible importance of human settlement patterns in relation to the availability of health-care and related facilities such as potable water, excreta disposal systems, etc. Thus, in a special sense it is much cheaper available to a community when it is densely settled rather than widely dispersed.
It is possible to argue, however, that both these sets of factors are closely related to a third one, namely income levels. Poorer mothers and babies have less access to health-care facilities and nourishment than those who are better-off, urban communities are on average much better-off than rural communities. That economic conditions play a crucial role in determining the status of both mother and child is beyond dispute. But the question really is whether this is the only decisive factor or whether factors such as the availability of medical facilities, health-care programmes and nutritional programmes have an independent role. If so, then the settlement patterns which affect service delivery to the mother and child target groups become a relevant consideration. These are clearly issues of some importance for policy and programme planning.
Which of the following can be inferred from the passage ?
Which of the following is the issue of importance for policy ?
Which, according to the passage, is the other main indicator of the status of children, besides infant mortality ?
What is the advantage of providing services in the urban areas, as compared to that of rural areas ?
Which of the following is the ‘’same’’ in meaning as the word ‘’access’’ as used in the passage ?
Which of the following is not to factor for mortality rate ?
Which of the following is the ‘’same’’ in meaning as the word ‘’complex’’ as used in the passage ?
Read the following passage carefully and answer the questions given below it. Certain words/phrases are printed in ‘’bold’’ to help you to locate them while answering some of the questions.
To open up a field of study, draw attention to its vital elements, the lecture is invaluable. To listen to a lecture can be thrilling experience from which the student may gain ideas obtainable in no other way. But possibly to a greater degree than other forms of instruction, lecturing presumes a high order of intellectual competence on the part of learners. The purposes of the lecture are to summarize, to clarify, to stimulate and to humanize the materials of the course. It should synthesize, evaluate, criticise and compare ideas and facts with which students have come in contact through out-of-class assignments.
The effectiveness of lectures could be enhanced by introducing the lecture with a brief review of the work preceding. It should also be indicated how the day’s lecture fits into the course pattern. A lecture should seldom be presented in one unbroken discourse. Unless exceptionally interesting, a long lecture ‘’strains’’ the capacity for concentrated listening, causing intermittent wandering of attention and loss of continuity in thought. The lecture should therefore be organized in a few block or units. As a rule, the exposition should be concluded before the end of the class period so as to allow some time for general discussion.
For students to obtain maximum benefit from a lecture, individual participation in study in both precede and follow it. On their own initiative, most students would not engage in preparatory study, hence formal assignments may be necessary. The lecture should be concluded on the assumption that the assignments has been fulfilled. It pays to explore the aids available for teaching a course particularly through lectures, since verbal exposition alone, however ‘’lucid’’ has its shortcomings.
Which of the following is the best suited title for the passage ?
Which of the following is the ‘’same’’ in meaning as the word ‘’strains’’ as used in the passage ?
An uninterrupted discourse type method results into…...
Which of the following is ‘’not true’’ in the context of the passage ?
Compared to other methods, lecturing requires …...
Solution
Login to view the detailed solution.
The passage seems to be written chiefly for ……..
Solution
Login to view the detailed solution.
The effectiveness of lectures can be enhanced by which of the following ?
A. Breaking it into units
B. SHowing its integration in the course
C. In the end giving some time for discussion
Solution
Login to view the detailed solution.
Which of the following is the same in meaning as the word ‘’lucid’’ as used in the passage ?
Solution
Login to view the detailed solution.
In each of the following sentences there are two blank spaces. Below each sentence there are five pairs of words denoted by number A, B, C, D and E. Find out which pair of words can be filled up in the blanks in the sentence in the same sequence to make the sentence grammatically correct and meaningfully complete.
As business pull down ……… barriers and ……… boundaries, integration and standardisation of work system will become even more important.
The co -operative model has …….. well in the dairy business in India, ……… it perhaps the most organised among all food business in the country.
The ………. of all good companies …….. faster to employee needs and, in some cases, actually know most people by name.
The year also saw the boom and boom of many dotcoms ……. the relentless advance of the internet …….. .
Our executive made a bold but, in his mind ……. figure that he hoped would ……….. to the customer’s vanity and wallet.
In each of the following questions, a number series is given. After the series, below it, a number followed by (a), (b), (c) and (d) is given. You have to complete the series following the same sequence as that of given series. Then answer the question that follows.

What will come in the place of (c)?
Solution
Login to view the detailed solution.
If the series 3,7,15,31 ......... and 2,a,b,c,d ........ follow the same logic, what will come in the place of (d) ?
Solution
Login to view the detailed solution.

What will come in the place of (b)?
Solution
Login to view the detailed solution.

What will come in the place of (d) ?
Solution
Login to view the detailed solution.
.jpg)
What will come in the place of (d) ?
Solution
Login to view the detailed solution.
For the following questions answer them individually
Present ages of Radha and Sudha are in the ratio of 7 : 9 respectively. Five years ago ratio of their ages that time was 3 : 4. What will be Sudha’s age after 3 years from now ?
Solution
Login to view the detailed solution.
What approximate value should come in place of the question mark (?) in the following equation ?
$$29.38 \times 37.05 \div ? + 7.45 = 100.5$$
Solution
Login to view the detailed solution.
The digits of a two-digit number are in the ratio of 2 : 3 and the number obtained by interchanging the digit is bigger than the original number by 27. What was the original number ?
Solution
Login to view the detailed solution.
70% of a number is equal to four-fifth of another number. If the difference between the two numbers is 100, what is the bigger number ?
Solution
Login to view the detailed solution.
The population of a state is counted after every three years. It is found that the population each time is increased by 20% as compared to the previous count. If the population in the year 1998 was 42 lakhs, what will be the population in the year 2007 ?
Solution
Login to view the detailed solution.
Two cars A and B are running in the same direction. Car ‘A’ had already covered a distance of 60 kms, when car ‘B’ started running. The cars meet each other in 3 hours after car ‘B’ started running. What was the speed of car ‘A’ ?
Solution
Login to view the detailed solution.
Four of the following five parts numbered A, B, C, D and E in the following equation are exactly equal. The number of the part which is not equal to the other four is your answer.
Solution
Login to view the detailed solution.
What quantity of water should be added to 3 litres of 10% solution of salt, so that it becomes a 5% salt solution ?
Solution
Login to view the detailed solution.
Mr. Nilesh Agrawal opened a workshop investing Rs. 40,000. He invested additional amount of Rs. 10,000 every year. After two years his brother Suresh joined him with an amount of Rs. 85,000. Thereafter Suresh did not invest any additional amount. On completion of four years from the opening of workshop they earned an amount of Rs. 1,95,000. What will be Nilesh’s share in the earning ?
Solution
Login to view the detailed solution.
In a class 45 students boys and girls are in the ratio of 5 : 4 respectively. Average marks obtained by boys in Mathematics out of 100 were 76 and that of girls were 78. What are average marks of boys and girls together in Mathematics (rounded-off to two decimal points) ?
Solution
Login to view the detailed solution.
What will come in place of both question mark (?) in the following equation ?
$$\frac {76\times 32 \div ? + 16}{6^{2} \div 9 \times 4 - ?} = 40$$
Solution
Login to view the detailed solution.
A right circular cylindrical tank has the storage capacity of 98808 ml. If the radius of the base of the cylinder is three-fourth of the height, what is the diameter of the base ?
Solution
Login to view the detailed solution.
A committee of 6 members is to be selected from a group of 8 men and 6 women in such as way that at least 3 men are there in the committee. In how many different ways can it be done ?
Solution
Login to view the detailed solution.
For which of the following values of x the inequality $$3(x^{2} - 4x + 4) < x $$ gets satisfied ?
Solution
Login to view the detailed solution.
What approximate value should come in place of the question mark (?) in the following equation ?
$$695.95\div 29.07 \times ? + 40.25 = 399.99$$
Solution
Login to view the detailed solution.
If the numerator of a fraction is increased by 40% and the denominator is doubled the new fraction obtained is $$\frac{7}{16}$$ . What was the original fraction ?
Solution
Login to view the detailed solution.
In how many different ways can the letters of the word ADJUST be arranged so that the vowels never come together ?
Solution
Login to view the detailed solution.
Abhishek invested an amount of Rs. 29,000 in two parts under two different schemes A and B and earned a total interest of Rs. 3, 840. Schemes A and B offered 15% and 12% simple interest respectively. What was the amount investment in Scheme ‘A’ ?
Solution
Login to view the detailed solution.
Cost of 25 pencils and 20 sharpeners is Rs. 100. If the cost of a sharpener is more than the cost of a pencil by 50 paise; what is the total cost of 3 pencils and 4 sharpeners?
Solution
Login to view the detailed solution.
What will be the effect on the area of an isosceles triangle if all the sides are doubled in length ?
Solution
Login to view the detailed solution.
Each of these questions have a question followed by information given in three statements I, II and III. You have to study the question along with the information in three statements and decide that the information in which of the statement(s) is/are necessary to answer the question ?
In how many days can the work be completed by 10 women ?
I. 5 men can complete the work in 8 days
II. 6 men and 4 women together can complete the work in 5 days
III. One man and one women together can do thrice the work done by a women in one day.
Solution
Login to view the detailed solution.
What is the principal amount ?
I. Difference between simple interest and compound interest for 2 years is Rs. 37.50
II. Simple interest for 3 years is Rs. 2,250
III. Simple interest and compound interest for the first year the equal.
Solution
Login to view the detailed solution.
What is the area of the rectangular garden ?
I. Perimeter of the garden is 220 metres
II. Length and breadth of the garden are in the respective ratio of 7 : 4
III. Length is less than twice the breadth by 10 metres
Solution
Login to view the detailed solution.
What was the population of state ‘A’ ?
I. Males and Females were in the ratio of 4 : 5 respectively
II. 70% of the population was literate
III. 8 lakh males were literate in the state
Solution
Login to view the detailed solution.
What is the speed of the train ?
I. The train crosses a signal pole in 14 secs
II. The train crosses another train in 16 secs
III. The train crosses a 200 metres long platform in 24 secs
Solution
Login to view the detailed solution.
Study the following graph carefully and answer the questions given below it.
Percent profit earned by three companies
A, B and C over the years 1994 to 2000
(Profit = Income - Expenditure)
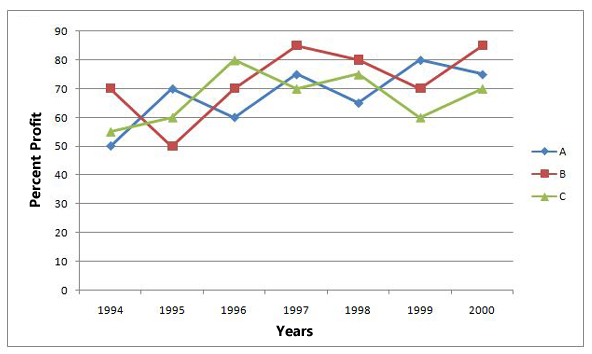
Expenditure of the three Companies in the year 2000 were equal. What was the ratio of incomes of companies. A, B and C respectively in that year ?
Solution
Login to view the detailed solution.
Expenditure of Company ’B’ in 1998 was Rs. 6.5 lakhs, which was equal to the income of Company ‘C’ in 1996. What was the ratio of income of COmpany ‘B’ in 1998 to the expenditure of Company ‘C’ in 1996 ?
Solution
Login to view the detailed solution.
Income of Company ‘C’ in 1999 was Rs. 1,68,000. What was the expenditure in that year ?
Solution
Login to view the detailed solution.
Income of Company ‘C’ in 1999 was Rs. 8.5 lakhs. What was its income in the year 2000 ?
Solution
Login to view the detailed solution.
Expenditure of Company ‘B’ in 1996 is equal to the income of Company ‘A’ in 1998. What is the respective ratio of the expenditure of Companies B and A in 1996 and 1998 respectively ?
Solution
Login to view the detailed solution.
Expenditure of Companies B and C in 1995 were equal. Then which of the following statements is ‘’definitely true’’ about the incomes of two companies in 1995 ?
Solution
Login to view the detailed solution.
Incomes of Company ‘A’ in 1994 and 1995 were equal. What was the ratio of its expenditure in these two years respectively ?
Solution
Login to view the detailed solution.
Study the following graph and table carefully and answer the questions given below it:
Distribution of Candidates appeared in a Competitive Examination from Seven States

Total candidates appeared = 3 lakhs
State-wise percentage and ratio of male and female qualified candidates

Which of the following pair of states have equal number of qualified male candidates ?
Solution
Login to view the detailed solution.
What is the number of male candidates qualified from state ‘G’ ?
Solution
Login to view the detailed solution.
What is the total number of candidates qualified from state ‘E’ and ‘D’ together ?
Solution
Login to view the detailed solution.
How many male candidates have appeared from state ‘D’ ?
Solution
Login to view the detailed solution.
What is the percentage of candidates have qualified from state ‘A’ and ‘C’ together, rounded off to two decimal points ?
Solution
Login to view the detailed solution.
How many female candidates have qualified from state ‘’F’’ ?
Solution
Login to view the detailed solution.
What is the total number of female candidates qualified from state ‘A’ and ‘B’ together ?
Solution
Login to view the detailed solution.
Study the following table carefully and answer the questions given below it.
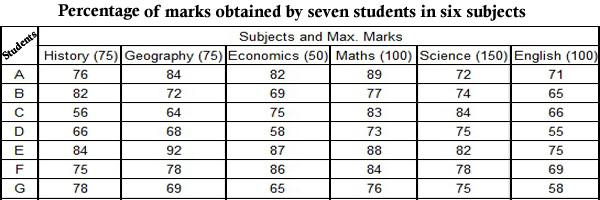
What is the percentage of marks (rounded-off to two decimals) obtained by student ‘E’ in all subjects together ?
Solution
Login to view the detailed solution.
What are the average marks obtained (rounded-off to two decimals) by all the students is in Science ?
Solution
Login to view the detailed solution.
What are the total marks obtained by student ‘C’ in all the subjects together ?
Solution
Login to view the detailed solution.
What are the total marks obtained by student ‘B’ in History and Economics together ?
Solution
Login to view the detailed solution.
What are the average marks (rounded-off to two decimals) obtained by all the students in Economics ?
Solution
Login to view the detailed solution.
What is the difference between the total marks obtained by students G and F in all the subjects together ?
Solution
Login to view the detailed solution.
For the following questions answer them individually
In a certain code AUTOMATIC is written as PUVBMBUJD. How is BUILDINGS written in that code ?
Solution
Login to view the detailed solution.
‘P $$\div$$ Q’ means ‘P is the brother of Q’, ‘P $$\times$$ Q’ means ‘P is sister of Q’, ‘P - R’ means ‘P is the father of Q’ and ‘P + Q' means ‘P is mother of Q’. Which of the following means S is maternal uncle of M ?
Solution
Login to view the detailed solution.
Among five student M is heavier than K and T. B is lighter than T and P, K is not the lightest. Who among the them is the lightest ?
Solution
Login to view the detailed solution.
If it is possible to make a meaningful word with the first, the third, the seventh and the eleventh letters of the word OMNIPRESENCE using each letter once, which of the following will be the second letter of that word ? If more than one such words can be made, give ‘M’ as the answer and if no such word can be made, give ‘R’ as the answer.
Solution
Login to view the detailed solution.
How many such pairs of letters are there in the word CREATION each of which has as many letters between them in the word as in the alphabet ?
Solution
Login to view the detailed solution.
Four of the following five are alike in a certain way and so form a group. Which is the one that ‘’does not’’ belong to that group ?
Solution
Login to view the detailed solution.
In a certain code JOINTLY is written as IPHOSMX. How is SERMON written in that code ?
Solution
Login to view the detailed solution.
In a certain code ‘5 6 9’ means ‘nice little car’, ‘8 3 5’ means ’he is nice’ and ‘9 3 7’ means ‘he has car’, which of the following means ‘has’ in that code ?
Solution
Login to view the detailed solution.
Four of the following five are alike in a certain way and so form a group. Which is the one that ‘’does not’ belong to that group ?
Solution
Login to view the detailed solution.
How many such letters are there in the word DECLARATION each of which is as far away from the beginning of the word as in English alphabet ?
Solution
Login to view the detailed solution.
In making decision about important questions, it is desirable to be able to distinguish between ‘strong’ arguments and ‘weak’ arguments so far as they relate to the question. Strong arguments are those which are are of major importance and directly related to the question. Weak arguments are those which are minor importance and also be directly related to the question of may be related to a trivial aspect of the question.
After each question two Argument I and II are given. You have to decide which argument is strong and which argument is weak.
Should there be only five holidays in a calendar year in all the states of India ?
Arguments:
I. Yes, we can not afford to lose so many working days as at present.
II. Yes, the USA has few holidays in a calendar year.
Solution
Login to view the detailed solution.
Should India make an all out effort to secure permanent membership of UN Security Council at any cost ?
Arguments:
I. Yes, this is the only way to establish its supremacy in the region.
II. No, there are many other urgent issues which need government’s immediate attention which will make life of citizens comfortable.
Solution
Login to view the detailed solution.
Should all ‘’bandhs’’ be banned all over the country ?
Arguments:
I. Yes, this will help the country to reduced wastage of productive mandays.
II. No, this is a democratic right of individuals or groups of individuals to demonstrate their protests.
Should all the under-trials be immediately freed from police custody ?
Arguments:
I. Yes, no body should be put to inconvenience unless proved guilty.
II. No, the culprits may again indulge into criminal activities.
Should all the Public Sector Undertakings (PSUs) be given full autonomy to carry out their business activities ?
Arguments:
I. Yes, this will help the PSUs to compete with the private sector and be profitable.
II. No, the PSUs need to be under government control to fulfil their social obligations.
Each of the questions below consists of a question and two statements numbered I and II given below it. You have to decide whether the data provided in the statements are sufficient to answer the question. Read both the statements and--
How is D related to M ?
I. M’s father has two daughters
II. K is married to D’s father
Solution
Login to view the detailed solution.
On which day of the week did Arun visit Delhi ?
I. Arun met his friend at Agra on Wednesday.
II. Arun reached Patna on Friday, the next day he met Vilas at Delhi.
Solution
Login to view the detailed solution.
How many students are there in a row ?
I. Manoj is the third from the right end.
II. Ashok is the fifth from the left end and thirteenth to the left of Manoj.
Solution
Login to view the detailed solution.
Towards which direction is B from F ?
I. S is to the south of B.
II. F is to the west of S.
Solution
Login to view the detailed solution.
Who among M, N, D and P is the youngest ?
I. D is older than N and younger than M and P.
II. N is younger than D and M.
Solution
Login to view the detailed solution.
Read the following information carefully and answer the questions given below :
P, Q, R, S, T and U are six employees of an organisation. There are at least two managers, at least two clerks and at least one officer among them. They work in three departments of COmputers, Sales and Marketing with at least two employees in each department. In no department there are employees belonging to same cadre. T works in Sales and is not a clerk. Q, a manager, works in Computers. P, the officer, works in Marketing, R, an officer, works with T. U does not work with P.
The two clerks work with in which of the following pairs of departments ?
Solution
Login to view the detailed solution.
In which of the following departments there is no Manager ?
Solution
Login to view the detailed solution.
What is T’S designation ?
Solution
Login to view the detailed solution.
With whom does S work in the same department ?
Solution
Login to view the detailed solution.
In which department does U work ?
Solution
Login to view the detailed solution.
In each of the questions below are given two statements followed by three conclusions numbered I, II and III. You have to take the given statements to be true even if they seem to be variance from commonly-known facts. Read all the conclusions and then decide which of the given conclusions logically follows from the given statements disregarding commonly-known facts.
Statements:
Some pencils are houses
All houses are buses.
Conclusions:
I. Some pencils are buses.
II. Some buses are pencils.
III. All buses are pencils
Solution
Login to view the detailed solution.
Statements:
No train is star
Some stars are men.
Conclusions:
I. Some men are trains
II. No men is train
III. All men are stars
Solution
Login to view the detailed solution.
Statements:
Some trees are roads.
All roads are stones
Conclusions:
I. All trees are roads
II. Some stones are trees
II. No stone is tree
Solution
Login to view the detailed solution.
Statements:
All books are cars
All cars are tigers
Conclusions:
I. All books are tigers
II. All tigers are books
III. All cars are books
Solution
Login to view the detailed solution.
Statements:
All books are pins
Some pins are desks
Conclusions:
I. Some desks are books
II. All desks are pins
III. No desk is book
Solution
Login to view the detailed solution.
Read the following information carefully and answer the questions given below :
Following are the criteria for hiring Marketing Manager in a company
The applicant must-----
(i) be a post graduate in Marketing Management
(ii) be at least 25 years old as on 30.4.2001.
(iii) have work experience of at least three years
(iv) be ready to work for at least two years after appointed.
However, if a candidate---
(a) fulfils all other criteria except at (i) above, but has work experience of more than five years-- the case is to be referred to General Manager-Marketing.
(b) fulfils all other criteria except at (iv) above, but has obtained Ph.D. Degree, the case may be referred to Vice President-Marketing.
Based on the above criteria and the information given in each case, you have to take the decision in each case. You are not assume anything. The cases are given to you as on 30.4.2001.
Shankar Trivedi was born on 27th August, 1972. He has been working since January 1992. He has appeared in the final examination of Part Time Post Graduate Programme in Marketing Management. He is ready to work for five more years.
Solution
Login to view the detailed solution.
Navin Asthana has been working for the last five years and is ready to work for another five years. He has obtained his post graduation in Marketing Management at the age of 21 in March 1996
Solution
Login to view the detailed solution.
Sunita Ajwani has passed her post graduation in Marketing Management in the year 1997 at the age of 21 and has been working since then. She is ready to work for at least ten years.
Solution
Login to view the detailed solution.
Sunil Malhotra was born on 31st August, 1971. He has passed his Master’s degree in Marketing Management in the year 1999 and has been working since then. He is ready to work for at least four years ?
Solution
Login to view the detailed solution.
Anil Sharma was born on 15th April, 1975. He has been working for the last four years after obtaining his post graduation in Marketing Management. He his ready to work for five years ?
Solution
Login to view the detailed solution.
Janaki Sharma has obtained her post graduation and Ph. D in Marketing Management. She is working for the last three years and is ready to work for one more year. She was born on 2nd October, 1973 ?
Solution
Login to view the detailed solution.
Prabhat Bakshi is a graduate and has been working for the last ten years. He was 23 years old as on 21st June, 1995. He is ready to work for two more years. He is ready to work for another ten years ?
Solution
Login to view the detailed solution.
Arun Samant has obtained his post graduation in Marketing Management in the year 1996 and has been working since then. He is ready to work for two more years. He was born on 3rd September, 1970 ?
Solution
Login to view the detailed solution.
Archana Madhok has been working for the last four years after obtaining her post graduation in Marketing Management. She was born on 7th July, 1970. She has also obtained her Ph. D. Degree. She is ready to work for one more year.
Solution
Login to view the detailed solution.
Santosh Mahajan has passed post graduation in Marketing Management and has also got Ph. D. in Marketing Management. He has been working for last five years and is ready to work for only one year.
Solution
Login to view the detailed solution.
In each question below is given a statement followed by two assumptions numbered I and II. An assumption is something supposed or taken for granted. You have to consider the statement and the following assumptions is implicit in the statement.
Statement : The government of India has appointed a Joint Parliamentary Committee to investigate into the recent stock market crash.
Assumptions:
I. The members of the committee may possess requisite expertise to carry out the investigation.
II. The people responsible for the crash may destroy all their documents before the committee lay their hands on them
Statement: The state government has issued a notification to the effect that all the coaching classes must register themselves immediately giving details of fees, infrastructural facilities and bio-data of teachers.
Assumptions:
I. All those coaching classes which do not have requisite infrastructure and teachers may close down
II. All the coaching classes may hereafter charge uniform fees for all the students
Solution
Login to view the detailed solution.
Statement: The Union Finance Minister has recently announced that those who earn upto Rs. 3 lakhs per annum will get the benefit of additional Rs. 5,000 under standard deduction.
Assumptions:
I. The people may welcome the decision and rally behind the government in its operation
II. The government may be able to manage with the revenue loss on account of the announcement
Statement: The management of the passenger car manufacturing company has decided to reduce its workforce in view of the sluggish demand in the market.
Assumptions:
I. The demand of cars manufactured by the company may continue to be lower in the near future
II. The company may be able to run its operation with the reduced work force.
Statement: The district authority has decided to set up wireless communication along the coastline in view of the cyclonic storm hitting the coast.
Assumptions:
I. The telephone communications systems may be able to withstand the fury of the cyclonic storm
II. The wireless communication systems may be able to withstand the fury of the cyclonic storm.
Below is given a passage followed by several possible inferences which can be drawn from the facts stated in the passage. You have to examine each inference separately in the context of the passage and decide upon its degree of truth or falsity.
Rarely is is realized that banning Africa, India enjoys the dublous distinction of having generated the largest number of displaced people a large majority in the name of development. The conservative estimate of the number of people displaced from 1950 to 1991 is about 21 millions, if one restricts the casual factors to dams, mines wildlife sanctuaries and industry. If one includes urban displacement due to various deliverate or planned activities, then the number would rise to 30-35 million. According to government records, at least 75% those displaced are still cared for or rehabilitated.
Natural calamities appear to be a major reason causing displacement in India.
Less than one-fourth of the displacement person in India appears to have been benefitted by rehabilitation schemes.
A large percentage of displacement people seem to be in the name of urban development.
Developed countries seemed to have carried out development work with suitable emphasis on proper rehabilitation.
Africa’s rate of development is higher than India.

