IIM Bangalore UG 13th Dec 2025
For the following questions answer them individually
IIM Bangalore UG 13th Dec 2025 - Question 31
Two rectangles are drawn on line segments of fixed widths. When the heights are 7 m and 8 m respectively, their areas sum up to 156 $$m^{2}$$. But if these heights are 5 m and 7 m respectively, then their areas sum up to 123 $$m^{2}$$. Find the sum of the areas of the squares (in $$m^{2}$$) drawn on the line segments.
IIM Bangalore UG 13th Dec 2025 - Question 32
The centroid of a triangle with vertices (2a,b),(-b,a) and (b,3a) is (4,11). The area of the triangle is ___ square units.
IIM Bangalore UG 13th Dec 2025 - Question 33
Let b and c be two real numbers such that the numbers 3, b, c are in geometric progression. For the matrix
$$A = \begin{bmatrix}1 & 1 & 1 \\3 & b & c \\9 & b^{2} & c^{2} \end{bmatrix}$$, if $$\text{det}\mid A \mid = 162$$, then the value of c is
IIM Bangalore UG 13th Dec 2025 - Question 34
The proportions of gold in three alloys are 40%, 50% and 80% respectively. These alloys are mixed in certain proportions to obtain 30 kg of a new alloy, which has 55% gold. If the amount of the first alloy is 9 kg, what is the amount in kg of the third alloy used?
IIM Bangalore UG 13th Dec 2025 - Question 35
A sportsperson could be an expert in badminton and / or squash. Given that someone is a squash expert, the probability that they are expert at badminton as well is 0.8. There are twice as many badminton experts as there are squash experts. Given that Saina is a badminton expert, what is the likelihood that she is an expert in squash?
IIM Bangalore UG 13th Dec 2025 - Question 36
Two positive integers m and n satisfy HCF (m, n) = 14 and LCM (m, n) = 168. If m < n and m divides 84, what is the maximum possible value of m?
The following graph shows the annual tourist arrivals (in thousands), both foreign and domestic, across five tourist regions (A to E) from 2010 to 2012.
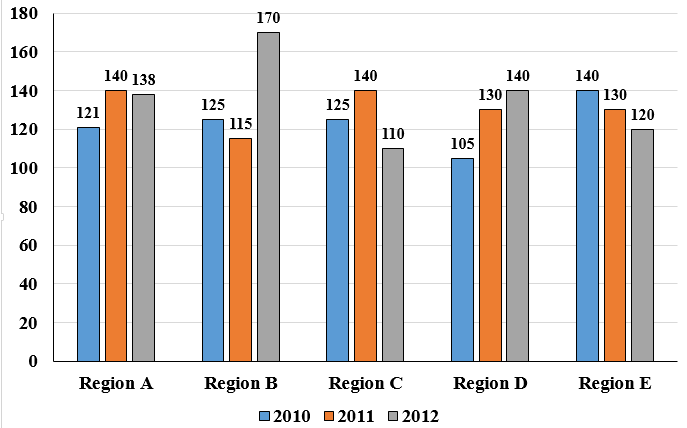
Based on this graph, answer the questions.
IIM Bangalore UG 13th Dec 2025 - Question 37
In 2012, if 10% of visitors in Region E were foreign tourists, then how many domestic tourists (in thousands) visited Region E in that year?
IIM Bangalore UG 13th Dec 2025 - Question 38
Foreign visitors to Region B form 15%, 20% and 25% of the tourist visits during 2010, 2011 and 2012 respectively. Assume that each foreign tourist spends ₹ 7,000, while each domestic tourist spends ₹ 3,000. What is the total revenue (in ₹ crores) from tourist spends during 2010-2012?
IIM Bangalore UG 13th Dec 2025 - Question 39
In 2010, the total spending per tourist in Region E was ₹6,000, and it increased by 10% in each successive year, while arrivals decreased as per the graph. What was the total spending (in ₹ crore) from Region E across 2010-2012?
IIM Bangalore UG 13th Dec 2025 - Question 40
In which region was the highest average tourist arrival recorded during 2010-2012?

.webp)