Sign in
Please select an account to continue using cracku.in
↓ →
Join Our IPMAT Preparation Group
Prep with like-minded aspirants; Get access to free daily tests and study material.
Analyse the given data for exports and imports of rubber in Rs. crores from 2006 to 2017 and answer the questions based on the analysis.
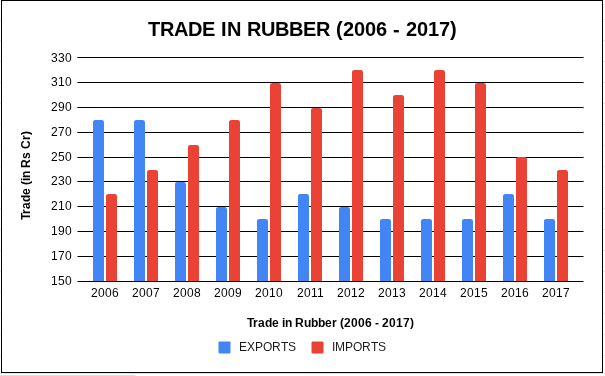
Balance of trade is defined as imports subtracted from exports ( = exports - imports). Which of the following blocks of three years has witnessed the largest average negative balance of trade?
2007-2009
2007: 280 - 240 = 40
2008: 230 - 260 = -30
2009: 210 - 280 = -70
Average = (40 - 30 - 70)/3 = -20
2015 - 2017
2015: 200 - 310 = -110
2016: 220 - 250 = -30
2017: 200 - 240 = -40
Average = (-30 - 40 - 110)/3 = -60
2014 - 2016
2014: 200 - 320 = -120
2015: 200 - 310 = -110
2016: 220 - 250 = -30
Average = (-120 - 110 - 30)/3 = -86.67
2010 - 2012
2010: 200 - 310 = -110
2011: 220 - 290 = -70
2012: 210 - 320 = -110
Average = (-110 - 70 - 110)/3 = -96.67
Largest average negative balance of trade = -96.67, for the year 2010 - 2012.
Click on the Email ☝️ to Watch the Video Solution
Create a FREE account and get:


Crack IPMAT 2026 with Cracku

Educational materials for IPMAT and IIMB UG preparation

Ask our AI anything

AI can make mistakes. Please verify important information.
AI can make mistakes. Please verify important information.
