Sign in
Please select an account to continue using cracku.in
↓ →
Join Our IPMAT Preparation Group
Prep with like-minded aspirants; Get access to free daily tests and study material.
The following graph shows the annual tourist arrivals (in thousands), both foreign and domestic, across five tourist regions (A to E) from 2010 to 2012.
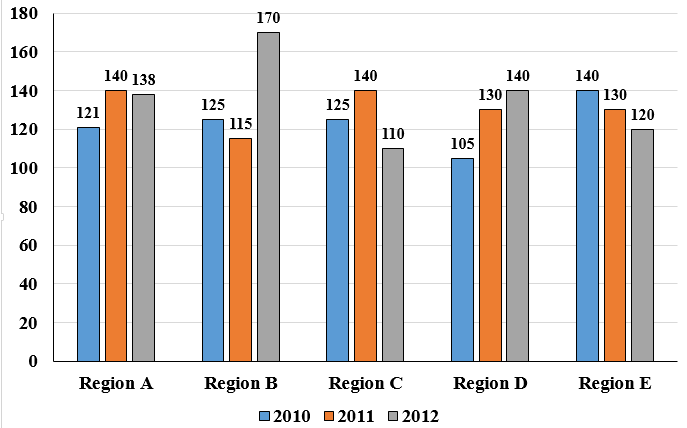
Based on this graph, answer the questions.
Average tourist arrival of Region A (in thousands) = $$\ \dfrac{\ 121+140+138}{3}=133$$
Average tourist arrival of Region B (in thousands) = $$\ \dfrac{\ 125+115+170}{3}=136.67$$
Average tourist arrival of Region C (in thousands) = $$\ \dfrac{\ 125+140+110}{3}=125$$
Average tourist arrival of Region D (in thousands) = $$\ \dfrac{\ 105+130+140}{3}=125$$
Average tourist arrival of Region E (in thousands) = $$\ \dfrac{\ 140+130+120}{3}=130$$
Thus, the average tourist arrival of Region B is the highest in the given time period of 2010-2012.
Crack IPMAT 2026 with Cracku

Educational materials for IPMAT and IIMB UG preparation

Ask our AI anything

AI can make mistakes. Please verify important information.
AI can make mistakes. Please verify important information.