Which of the following is considered as financial derivatives ?
RBI Grade B 17 NOV 2002
For the following questions answer them individually
Following a dispute over the distribution of petrol pumps, LPG distributions and Kerosene
dealership, all the allotments belonging to which of the following periods got cancelled ?
RBI has recently issued following instructions in respect of exchange control of goods and
services export. Which of these is not correct ?
The 'Arria Formula' which was recently in news is
As per the reports published in print media, the revenue collection may miss budget targets in current year also. Which of the following is the target fixed in terms of the per cent of GDP ?
Which of the following statements is not true about the 'Asian Brown Cloud', a project report
which was in news recently ?
(A) The report is prepared by a agency of the United Nations Organisation.
(B) The report says that impact of vast pollution clouds was damaged the weather system and
monsoon pattern.
(C) The Govt. of India has accepted the report and has taken steps to protect the system from
further damages.
All members of the Election Commission led by the Chief Election Commissiner visited which of the following states in August 2002 so that they can take decision to announce Assembly elections there ?
As per present norms the Mergers and Acquisitions in the corporate sector need a clearance from which of the following in addition to RBI etc. ?
(A) High Courts of the Respective states
(B) Union Cabinet
(C) Cabinet of respective states
Which among the following statements is/are TRUE regarding Reserve Bank of India's (RBI) annoucement to provide 5 per cent relief to the banks who provide 'Sail of Pete' fund ?
C.R.M.D has been established by the big banks. C.R.M.D. means
'Which among the following countries imported largest quantity of steel in the first quarter of the fiscal 2002-03?
Which among the following currency has been allowed as an intermediary with American dollar in India ?
Which among the following telephone system is regarded cheapest ?
The bond in which future dates are fixed for sell & purchase are known as —
According to the new guidelines of Reserve Bank of India [RBI), a person's individually earned foreign currency can be deposited in which of the following accounts ?
With the development of Information Technology & Internet, Banks have started now to use C.RM. system. The full form of C.RM. is
The full form of E.E.F.C. is
Which among the following is the main objective of 'Granted Postal Service' started recently in India ?
Which among the following is the objective of a cut in the Bank Rate announced by Reserve Bank of India ?
According to the World Bank Report, India has retained its position as the world's fourth largest economy. Which of the following countries are ahead of India ?
Which of the following is/are TRUE about the Iraq's relations with USA which is/are very much in
news these days?
(A) USA decides to attack on Iraq as does not want Saddam Hussein to rule Iraq.
(B) USA feels that Iraq has helped terrorist groups.
(C) Germany and several other countries are not supporting USA's sand on Iraq.
Mr. Rudiger Dornbusch who died recently was a famous ?
Driss Jettou was recently in news as he has become the
As per the decision taken by the Union Govt. which of the following states is now included in the
North Eastern Council (since 1998) ?
Which of the following is the objective of introduction of 'Know-your-customer' scheme as
introduced by RBI ?
RBI has directed hanks to charge interest on every month instead of on a quarterly basis from April 2002. Which of the following is the objective of this move of RBI?
Who amongst the following, while addressing the conference of Bank Economists, called for a
paradigm shift in banking from 'demand following' system to a 'supply-leading role'?
Which of the following indicates the calories required by a normal and generally healthy adult
per day as food?
The Reserve Bank of India in the beginning of the year 2002 provided some relaxation in the
norms for agricultural advances made by the commercial banks. Which of the following is NOT
TRUE in the regard ?
(A) Earlier these norms were applicable only for direct agricultural advacnes but now all short-
term agricultural crop loans are also covered.
(B) For reckoning non-performing assets norms of four harvesting seasons should be made
applicable.
(C) Each harvesting season should be of one year duration.
A new chapter related to Panch-ayats has been added in the Part LX of the Indian Constitution
which among the following is not a part of this ?
According to existing rules all Mutual Funds are under Security and Exchange Board of India
(SEBI). Which among the following is an exception?
Which among the following is the correct definition of 'Sex Ratio' ?
Why was the South Korean City 'Busan' recently in news ?
The GDP growth rate in the fiscal 2002 was
Which among the following statements is NOT related to India's Export-Import Policy of the period 2002-07 ?
Which among the following statements is/are TRUE regarding literate person defined in Census
2001 ?
Which among the following statements is/are TRUE regarding recently held reelections in West
Germany ?
(A) Chancellar of Germany Jerard Shreoder won the election.
(B) Joint front of Social Democrat and Greens Party was defeated badly.
(C) According to German Constitution only Chancellor can remain on his post despite his party's defeat.
What is the percentage of credit card holders in India compared to the total population of India ?
Which of the following Bills is always presented in the Lok Sabha first and then to the Rajya Sabha ?
Who amongst the following film personalities celebrated his/her 60th birthday in October 2002?
Which of the following is TRUE about the decision taken by the Union Government on export of
grain in wake of drought in the country?
(A) The export of grain is now totally banned as the country is facing severe drought.
(B) The Union Govt. has decided to put a ban on export of rice but wheat and pulses are free for
export.
(C) The Govt. has decided to allow export of all the grains despite the severe drought.
Which of the following institutes/organisations has instituted an award known as 'Mother Teresa Award for Corporate Citizen' ?
Which of the following is True about East Timor ?
Which vitamin keeps the eyes healthy?
As per the Constitution (SC/ ST) orders Amendment Bill 2002, the people belonging to which of the following are also included in the list of SCs/ STs?
Durand Cup is associated with
Which of the following is the book written by Dr. A. P. J. Abdul Ka1am ?
Who amongst the following is/ was NOT famous as an author?
Late Priya Tendulkar who died recently was a famous ?
Which of the following awards is given for contribution to the field of literature ?
Solution
Login to view the detailed solution.
In each of the following questions there is a sentence with a pair of blank spaces, followed by ve pair of words. Choose the pair that can ll up the blanks in the same order. The number of that pair is your answer.
Handicrafts constitute an important ..................of the decentralised sector of India's economy and employment to over six million artisans.
Among a number of hobbies that one can.............. , the hobby of reading is the most useful and .............
The quality of.................. between individuals and the organisation for which they work can be.............. to the bene t of both the parties.
Part of the confusion in our societies.............. from our pursuit of ef ciency and economic growth, in the.......... that these the necessary ingredients wards of progress.
The problem of housing shortage............ with the population explosion has also been by this policy.
In each of the following questions four words are given of which two words are most nearly the same or opposite in meaning. Find the two words which are most nearly the same or opposite in meaning and indicate the number of that pair of words as the answer.
(A) Audacious
(B) Venturous
(C) Abstruse
(D) Silent
(A) Eudemonia
(B) Extol
(C) Eulogise
(D) Energise
(A) Recluse
(B) Pandemic
(C) Transparent
(D) Opaque
(A) Diminutive
(B) Intelligent
(C) Large
(D) Proli c
(A) Enormous
(B) Malign
(C) Absorb
(D) Slander
In the following passage, there are blanks, each of which has been numbered. These numbers are printed below the passage and against each, ve words are suggested, one of which ts the blank appropriately. Find out the appropriate word in each case. Studies (1)the impact of computer models to support policy-making processes in organizations have (2)that client involvement in the model-building process is often a (3)for effective model building. One important reason is that the process of model building is frequently more important than the resulting model. Model building itself is largely a (4)process about the problem. Most (5)about the characteristics of an ill- structured problem are gained during the (6)process of designing a computer model, rather than after the model is nished. Another important reason is that most information in an organisation (7)in the mental models of organisation members. To support policy making in organisation it is this knowledge which needs to be (8)and represented in the model. An important topic in client-oriented or (9)model building thus becomes the (10) of relevant knowledge contained in the mental models of participants.
(1)
(2)
(3)
(4)
(5)
(6)
(7)
(8)
(9)
(10)
Rearrange the following six sentences (A), (B), (C), (D), (E) and (F) in the proper sequence to form a meaningful paragraph, then answer the questions given below them.
(A) We were interested by contrast in understanding what lessons actual teams and non-teams had for others to choose to struggle with change and performance.
(B) Still, we suspected that most of these focussed on persuading readers that "teams are important".
(C) After all we thought teams are a well-known subject and there must be a thousand books on the subject already.
(D) By going down this path we hope to discover something to say that was different from most books on the subject.
(E) We approached the idea of a book on teams cautiously.
(F) Alternatively they focussed on providing you to advise on building teams as an objective in itself.
Which of the following will be the SECOND sentence ?
Which of the following will be the FIRST sentence ?
Which of the following will be the THIRD sentence ?
Which of the following will be the FIFTH sentence ?
Which of the following will be the LAST sentence ?
Read the following passage carefully and answer the questions given below it. Certain words/expressions are given in bold in the passage to help you locate them while answering some of the questions.
Radically changing monsoon patterns, reduction in the winter rice harvest and a quantum increase in respiratory diseases-all part of the environmental doomsday scenario which is reportedly playing out in South Asia. According to a United Nations Environment Programme report, a deadly three-km deep blanket of pollution comprising a fearsome cocktail of ash, acids, aerosols and other particles has enveloped this region. For India, already struggling to cope with a drought, the implications of this are devastating and further crop failure will amount to a life and death question for many Indians. The increase in. premature deaths will have adverse social and economic consequences and a rise in morbidities will place an unbearable burden on our crumbling health system. And there is no one to blame but ourselves. Both official and corporate India has always been allergic to any mention of clean technology. Most mechanical two wheelers roll off the assembly line without proper pollution control system. Little effort is made for R & D on simple technologies, which could make a vital difference to people's lives and the environment . However, while there is no denying that South Asia must clean up its act, skeptics might question the timing of the haze report. The Johannesburg meet on Rio+10 is just two weeks away and the stage is set for the usual battle between the developing world and the West, particularly the U.S. President Mr. Bush has adamantly refused to sign any protocol, which would mean a change in American consumption level. U.N. environment report will likely to nd a place in the U.S. arsenal as it plants an accusing nger towards controls like India and China. Yet the U.S. can hardly deny its own dubious role in the matter of erasing trading quotas. Richer countries can simply buy up excess credits from poorer countries and continue to pollute. Rather than try to get the better of developing countries, who undoubtedly have taken up environmental shortcuts in their bid to catch up with the West, the U.S. should take a look at the environmental profligacy, which is going on within. From opening up virgin territories :or oil exploration to relaxing the standards for drinking water, Mr. Bush's policies are not exactly beneficial , not even to America's interests. We realize that we are all in this together and that pollution anywhere should be a global concern other wish only be more tunnels at the end of the
tunnel.
Both and corporate India is allergic to :
Which, according to the passage. is a life and death question to many Indians ?
If the rate of premature deaths increases it will
Choose the word which is SIMILAR in meaning of the word 'pro igacy' as used in the passage.
According to the passage, India cannot tolerate any further:
According to the passage, two wheeler industry is not adequately concerned about
What could be the reason behind timing of the haze report just before the Johannesburg meet, as indicated in the passage ?
choose the word which is SIMILAR in meaning of the word 'allergic' as used in the
Which of the following is the indication of environmental degradation in South Asia ?
What must we realise, according to the passage ?
Which of the following nds place in the United Nations Environment Programme Report?
Which of the following statements is NOT TRUE in the context of the passage ?
According to the passage, Johannesburg meet is going to witness
Choose the word which is MOST OPPOSITE in meaning to the word 'dubious' as used in the passage ?
Choose the word which is the MOST OPPOSITE in meaning to the word 'morbidity' as used in the passage.
For the following questions answer them individually
A shopkeeper sold a T.V. set for Rs. 17,940/-, with a discount of 8% and gained 19.6% If no discount is allowed, what will be his gain per cent?
Solution
Login to view the detailed solution.
Four of the following five options given below are equal. Which of the following is not equal to the other four?
Solution
Login to view the detailed solution.
Which value of x does satisfy the inequality $$2x^{2} + x - 3 < 0$$?
Solution
Login to view the detailed solution.
What will come in place of the question mark (?) in the following equation ?
$$\sqrt{625.04}\times16.96+136.001\div17=?$$
Solution
Login to view the detailed solution.
A bag contains 2 red, 3 green and 2 blue balls. 2 balls are to be drawn randomly. What is the probability that the balls drawn contain no blue ball ?
Solution
Login to view the detailed solution.
In each of the following questions, one or two equations (s) is/are given. On
their basis you have to determine relation between x and y and then,
Give answer a: if x < y
Give answer b: if x > y
Give answer c: if x ≤ y
Give answer d: if x ≥ y
Give answer e: if x = y
I. $$x^{2} + 3x + 2 = 0$$
II. $$2y^{2} = 5y$$
Solution
Login to view the detailed solution.
I. $$2x^{2} + 5x + 2 = 0$$
II. $$4y^{2} = 1$$
Solution
Login to view the detailed solution.
I. $$y^{2} + 2y - 3 = 0$$
II. $$2x^{2} - 7x + 6 = 0$$
Solution
Login to view the detailed solution.
I. $$x^{2} + 2x - 8 = 0$$
II. $$y^{2} - 2 = 7$$
Solution
Login to view the detailed solution.
I. $$x^{2} - 5x + 6 = 0$$
II.$$y^{2} + y - 6=0$$
Solution
Login to view the detailed solution.
In each of the following questions a number series is given. After the series a number is given followed by (a), (b) (c), (d) and (e). You have to complete the series starting with the number given, following the sequence of the original series and answer the questions that follow the series.
5, 6, 16, 57, 244, 1245
2 (a) (b) (c) (d) (e)
What will come in place of (d)?
Solution
Login to view the detailed solution.
3, 5, 9, 17, 33, 65
7 (a) (b) (c) (d) (e)
What will come in place of (d)?
Solution
Login to view the detailed solution.
3, 4, 5, 9, 20, 52.
3 (a) (b) (c) (d) (e)
what will come place of(c)
Solution
Login to view the detailed solution.
3, 10, 32, 111, 460, 2315
2 (a) (b) (c) (d) (e)
What will come in place of (b)?
Solution
Login to view the detailed solution.
5, 8, 6, 10, 7, 12
7 (a) (b) (c) (d) (e)
What will come in place of (c)?
Solution
Login to view the detailed solution.
In each of the following questions, a question is followed by information given in three statements. You have to study the question alongwith the statements and decide the information given in which of the statement (s) is necessary to answer the question.
What is the cost of flooring the rectangular hall ?
I. Length and the breadth of the hall are in the respective ratio of 3 : 2.
II. Length of the hall is 48 metres and cost of flooring is Rs. 850/- per square metre.
III. Perimeter of the hall is 160 metres and cost of flooring is Rs. 850/- per square metre.
Solution
Login to view the detailed solution.
What is the rate of interest per cent?
I. An amount doubles itself in 5 years on simple interest.
II. Difference between the compound interest and the simple interest earned on a certain amount in two years is Rs. 400.
III. Simple interest earned per annum is Rs. 2,000.
Solution
Login to view the detailed solution.
What is the two digit number?
I. The difference between the two digit number and the number formed by interchanging the digits is 27.
II. The difference between the two digits is 3.
III. The digit at unit’s place is less than that at ten’s place by 3.
Solution
Login to view the detailed solution.
What is the present age of Subir?
I. The present age of Subir is half to that of his father.
II. After 5 years, the ratio o Subir’s age to that of his father’s age will be 6 : 11.
III. Subir is 5 years younger than his brother.
Solution
Login to view the detailed solution.
In how many days can 10 women finish a work ?
I. 10 men can complete the work in 6 days.
II. 10 men and 10 women together can complete the work In 3 3/7 days.
III. If 10 men work for 3 days and there after 10 women replace them, the remaining work is completed in 4 days.
Solution
Login to view the detailed solution.
These questions are based on following graphs. Classification of appeared candidates in a competitive test from different States and qualified candidates from those States.


What is the ratio between the number of appeared candidates from States C and E together and the appeared candidates from States A and F together ?
Solution
Login to view the detailed solution.
In which State, the percentage of qualified candidates to that of appeared candidates is minimum ?
Solution
Login to view the detailed solution.
What is the difference between the number of qualified candidates of States D and G?
Solution
Login to view the detailed solution.
What is the percentage of qualified candidates to that of appeared candidates from States B and C taken together? (rounded to two decimal places).
Solution
Login to view the detailed solution.
What is the ratio between number of candidates qualified from States B and D together and the number of candidates appeared from State ‘C’ respectively ?
Solution
Login to view the detailed solution.
Study the following table carefully to answer these questions.
Percentage of marks obtained by six students in six subjects

What are the total marks obtained by Student R in Subjects B, D and E ?
Solution
Login to view the detailed solution.
What are the average marks obtained by all the students in Subject ‘C’ ? (rounded off to the nearest integer)
Solution
Login to view the detailed solution.
What is the average percentage of marks obtained by all the students in Subject ‘A’ ?
Solution
Login to view the detailed solution.
Approximately what is the overall percentage of marks obtained by Q in all the Subjects ?
Solution
Login to view the detailed solution.
What are the total marks obtained by all the students together in Subject E ?
Solution
Login to view the detailed solution.
These questions are based on the graph given below :
Per cent-Pro t earned by six companies during 2000 and 2001

If the income of company A in the year 2001 was Rs. 35 lakhs, what was its expenditure in that year ?
Solution
Login to view the detailed solution.
If, in year 2001, total expenditure of companies B and C was Rs. 48 lakhs, then what was their total income in the same year ?
Solution
Login to view the detailed solution.
If, in year 2000, expenditure of company C was Rs. 32 lakhs, what was the income of the company in the same year ?
Solution
Login to view the detailed solution.
If the expenditure of company E in years 2000 and 2001 was same, what was the ratio of the incomes of the company in the same year respectively?
Solution
Login to view the detailed solution.
The income of company D in year 2000 was Rs. 31 lakhs, what was the earned profit ?
Solution
Login to view the detailed solution.
Study the following table carefully and answer the questions given below :
Number of students studying in different faculties in Seven institutions
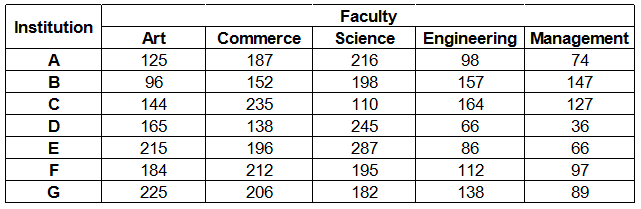
What is the percentage of students studying Science to the total number of students studying in the institute G ?
Solution
Login to view the detailed solution.
Out of the total students of the institute D, approximately, what percentage of students are studying Management ?
Solution
Login to view the detailed solution.
The total number of students studying Art in institutes A, B and C together is approximately what per cent of total number of students studying Commerce in institutes D, E, F and G together ?
Solution
Login to view the detailed solution.
What is the percentage of students studying Engineering in institute C to the total students of all institutions studying Engineering ? (rounded to the nearest integer)
Solution
Login to view the detailed solution.
In which institution, the percentage of students studying Commerce to the total students of that institution is maximum ?
Solution
Login to view the detailed solution.
Study the following elements (letters, digits and symbols sequence ) to answer the question given below :
A B 7 C D 9 Z Y * P 2 M © K S 3 ↑ 5 N T @
(Note: ‘A’ is to the left of ‘B’ and ‘@’ is to right of ‘T’ )
If each symbol of the above sequence is replaced with letter and each digit is replaced with new symbol, then how many letters will be there in the sequence ?
Solution
Login to view the detailed solution.
How many such digits are there in the sequence each of which is immediately preceded as well as followed by letters ?
Solution
Login to view the detailed solution.
Which of the following letters is exactly midway between only letters falling between ‘C’ and ‘5’ ?
Solution
Login to view the detailed solution.
If each symbol of the above sequence is replaced with the digits from ‘ 1’ to ‘9’ which are not there in the sequence, then what will be the sum of all digits ? [Each symbol should be replaced with different digit).
Solution
Login to view the detailed solution.
If the first element from the left interchanges place with the tenth element from the left, similarly second with ninth, third with eighth, fourth with seventh and so on, then which of the following will be seventh to the left of eighth element from the right?
Solution
Login to view the detailed solution.
For the following questions answer them individually
Which of the following is related to ‘Melody’ in the same of way as ‘Delicious’ is related to ‘Taste’ ?
Solution
Login to view the detailed solution.
A trader in order to code the prices of article used the letters of PSICHOLAZY in the form of ‘0 to 9’ respectively. Which of the following code stands for Rs. 875.50 ?
Solution
Login to view the detailed solution.
If the positions corresponding to the multiples of five in the following alphabet are replaced by symbols and that of multiples of seven by digits, how many letters will be left ?
A B C D E F G H I J K L M N O P Q R S T U V W X Y Z
Solution
Login to view the detailed solution.
What should come in the place of question mark (?) in the following letter sequence ?
AZB, CYD, EXF, ?, IVJ, KUL
Solution
Login to view the detailed solution.
Find the two letters in the word EXTRA which have as many letters between them in the word as in the alphabet. If these two letters are arranged in alphabetical order which letter will come second?
Solution
Login to view the detailed solution.
Each of the questions below consists of a statement and/or a question and two statements numbered I and II given below it. You have to decide whether the data provided in the statements are sufficient to answer the question. Read both the statements and -
Give answer a: if the data in Statement I alone are sufficient to answer the question, while the data in Statement II alone are not sufficient to answer the question.
Give answer b: if the data in Statement II alone are sufficient to answer the question, while the data in Statement I alone are not sufficient to answer the question.
Give answer c: if the data either in Statement I or in Statement II alone are sufficient to answer the question.
Give answer d: if the data even in both Statements I and II together are not sufficient to answer the question.
Give answer e: if the data in both Statements I and II together are necessary to answer the question.
(Caution : Do not hasten to mark the answer unless you consider both the Statements carefully).
A box contains oranges, bananas and apples. How many apples are there in the box ?
I. Of the hundred fruits in the box, fifty percent constitute oranges and bananas together.
II. Fifty percent of the fruits in the box are apples.
Solution
Login to view the detailed solution.
The area of a playground is 1600 square metres. What is its perimeter ?
I. It is perfect square playground.
II. It costs Rs. 3200 to put a fence around the playground at the rate of Rs. 20/- per metre.
Solution
Login to view the detailed solution.
A, B, C and D made their project presentation, one on each day, on four consecutive days but not necessarily in that order. On which day did ‘C’ make his presentation ?
I. The first presentation was made on 23rd, Tuesday and was followed by ‘D’s presentation
II. ‘A’ did not make his presentation on 25th and one of them made his presentation, between that of A’s and B’s.
Solution
Login to view the detailed solution.
What is the shortest distance between Devipur and Durgapur ?
I. Durgapur is 20 kms. away from Rampur.
II. Devipur is 15 kms. away from Rampur.
Solution
Login to view the detailed solution.
In a certain code “al ed nop” means “We play chess”. Which code word means “chess” ?
I. ‘id nim nop” means “We are honest”
II. “gob ots al” means “They play cricket”
Solution
Login to view the detailed solution.
“You must submit your application within 10 days from the date of release of this advertisement”. What is the exact date before which the application must be submitted ?
I. The advertisement was released on 18th February.
II. It was a leap year.
Solution
Login to view the detailed solution.
Kiran is older than Manoj and Dilip is older than Neelam. Who among them is the youngest ?
I. Kiran is older than Neelam.
II. Manoj is younger than Dilip.
Solution
Login to view the detailed solution.
‘B’ is the sister of ‘A’. How is ‘A’ related to ‘B’ ?
I. ‘A’ is the brother of ‘C’.
II. ‘A’ is the uncle of ‘D’.
Solution
Login to view the detailed solution.
Brinda’s merit rank is 17th in her class. What is her rank from the last ?
I. There are 70 students in her class.
II. Nisha who ranks 20th in Brinda’s class is 51st from the last.
Solution
Login to view the detailed solution.
Mandar is taller than Sunil and Raghu is shorter than Abhishek. Who among them is the shortest ?
I. Raghu is shorter than Mandar.
II. Abhishek is shorter than Sunil.
Solution
Login to view the detailed solution.
In each of the following questions a statement is given followed by two assumptions numbered I and II. An assumption is something supposed or taken for granted. You have to consider the statement and the following assumptions and decide which of the assumptions is implicit in the statement, then select the correct answer from the alternatives (1),(2), (3), (4) and (5).
Give answer a: if only assumption I is implicit.
Give answer b: if only assumption II is implicit.
Give answer c: if either assumption I or II is implicit.
Give answer d: if neither assumption I nor II is implicit
Give answer e: if both the assumptions I and II are implicit.
Statement : The Government should engage army for the rapid rehabilitation of people affected by the cyclone.
Assumptions
I. Only army can rehabilitate the people affected by cyclone quickly.
II. Army can take up other works also other than war.
Statement : His recent investment in the shares of Company ‘A’ is only a gamble.
Assumptions
I. He may incur loss on his investment.
II. He may gain from his investment.
Statement : Government should deploy army at least this year for the rehabilitation of people affected by cyclone because cyclone visits suddenly.
Assumptions
I. The army should be deployed for all such sudden incidents.
II. Some precautionary plan is being made to prevent destruction caused by cyclone.
Statement : It is not true always that the adoption of latest technology ensures increased productivity and capacity.
Assumptions
I. It is possible to prove the increased productivty and capacity due to adoption of latest technology.
II. The productivity and capacity can be increased by discarding latest technology.
Statement : If you could not collect required amount by oral call you must publish an advertisement in a widely read newspaper.
Assumptions
I. Usually people respond to oral call rarely.
II. Generally people are reluctant to read advertisement in newspaper.
Study the following information to answer the questions given below :
‘A * B’ means ‘multiply A by B.
‘A @ B’ means ‘subtract B from A’.
‘A $ B’ means ‘add B to A’.
‘A # B’ means ‘divide A by B’
What is the average of five consecutive odd numbers, if S is the lowest number among them ?
(A) (S $ 20) # 5
(B) 16 # 5 $ S
(C) (20 $ S) # 5
Solution
Login to view the detailed solution.
If the cost of 6 pens is Rs. 30, how many pens can be bought for Rs. 900 ?
(A) 6 *30 # 900
(B) 900 *6 # 30
(C) 900 $ 6 # 30
Solution
Login to view the detailed solution.
Two hundred per cent of m = 60 per cent of P. therefore P =?
(A) 2 * m * 100 # 60
(B) 200 * m # 100 * 60
(C) m * 10 # 3
Solution
Login to view the detailed solution.
Mahesh donates 7% of his monthly salary R to charity and spends Rs. 3000 per month on his house rent. What is the balance amount out of his monthly salarly ?
(A) R @ 7 * R # 100 $ 3000
(B) R @ 3000 @ 7 *100 # R
(C) R @ (R * 7 # 100 $ 3000)
Solution
Login to view the detailed solution.
The area of a circle is computed by multiplying the square of its radius by 22/7. What will be the total area of 14 circles, each with the same radius of ‘r’ cms. ?
(A) 22 * r *7 * r # 14
(B) 22 # 14 * r * r
(C) 44*r*r # 7
Solution
Login to view the detailed solution.
For the following questions answer them individually
If B is coded as 8, F is coded as 6, Q is coded as 4, D is coded as 7, T is coded as 2, M is coded as 3, and K is coded as 5, then what is the coded form of QKTBFM ?
Solution
Login to view the detailed solution.
If $ means ‘plus (+), # means ‘minus (-), @ means ‘multiplied (x) and * means ‘divided ($$\div$$), then what is the value of
’16 $ 4 @ 5 # 72 * 8’ ?
Solution
Login to view the detailed solution.
Of the five villages P, Q, R, S and T situated close to each other, P is to west of Q, R is to the south of P, T is to the north of Q and S is to the east of T. Then R is in which direction with respect to S ?
Solution
Login to view the detailed solution.
Introducing Sarita, Meena said, “She is the only daughter of my father’s only daughter”. How is Meena related to Sarita ?
Solution
Login to view the detailed solution.
If it is possible to make only one meaningful English word from the sixth, the fifth, the twelfth and the fourth letters of the word IMAGINATIONS using each letter only once, the second letter of that word is your answer. If no such word can be made mark ‘X’ as your answer and if more than one such word can be formed, mark ‘M’ as your answer.
Solution
Login to view the detailed solution.
If each of the letters in the English alphabet is assigned odd numerical value beginning A = 1, B = 3 and so on, what will be the total value of the letters of the word "INDIAN" ?
Solution
Login to view the detailed solution.
If in a certain code language ‘pen pencil’ is written as ‘$ £’; ‘eraser sharpener’ is written as ‘@ #’ and ‘pencil eraser’ is written as ‘$ @’, then what is the code for ‘pen’ ?
Solution
Login to view the detailed solution.
Study the following arrangement of letters/symbols and answer the questions given below :
D F J T $ # P R Z Q * C M A B @ H K L S + ?
How many such symbols are there each of which is immediately preceded by a symbol and immediately followed by a letter ?
Solution
Login to view the detailed solution.
If the order of first half of the arrangement is reversed which of the following letters/symbols will be the fifth to the left of the fifteenth letter/symbol from the left ?
Solution
Login to view the detailed solution.
If all the symbols of the above sequence are denoted by 7 and each letter is denoted by 5, then what will be the sum of all the elements of the sequence ?
Solution
Login to view the detailed solution.
If all the symbols from the above sequence are dropped, which letter will be seventh to the right of twelfth letter from the right ?
Solution
Login to view the detailed solution.
Which of the following is related to ‘FT’ in the same way as ‘DJ’ is related to ‘?S’ ?
Solution
Login to view the detailed solution.
How many such letters are there in the above sequence each of which occupies the same position from the left in the sequence as in the alphabet from left ?
Solution
Login to view the detailed solution.
Four of the following five are alike on the basis of their position in the above sequence and hence form a group. Which one of the following does not belong to that group?
Solution
Login to view the detailed solution.
Which of the following will be exactly midway between fifth element from the left and eighth element from the right?
Solution
Login to view the detailed solution.
In making decisions about important questions, it is desirable to be able to distinguish between ‘strong’ arguments and ‘weak’ arguments. ‘Strong’ arguments are those which are both important and directly related to the question. ‘Weak’ arguments are those which are of minor importance and also may not be directly related to the question or may be related to a trivial aspect of the question.
Instructions : In each of the following a question is followed by two arguments numbered I and II.
You have to decide which argument is strong and which argument is weak.
Give answer a: if only argument I is strong.
Give answer b: if only argument II is strong.
Give answer c: if either argument I or II is strong.
Give answer d: if neither argument I nor II is strong.
Give answer e: if both the arguments I and II are strong.
Statement : Should the existing labour laws be changed in the favour of owners ?
Arguments
I. Yes, because the existing labour laws give much more protection to employees than required and thus production is reduced.
II. No, because owners would exploit employees as before when there were no labour laws.
Solution
Login to view the detailed solution.
Statement : Should India acquire/manufacture the latest nuclear weapons ?
Arguments
I. Yes, the enemies of India are improving their weapons continuously.
II. No, it will be against our policy of maintaining world peace.
Solution
Login to view the detailed solution.
Statement : Should animal be killed in the name of laboratory experiment ?
Arguments
I. Yes, they are available in abundance.
II. No, we have been supporting non-violence on every step of our lives.
Solution
Login to view the detailed solution.
Statement : Should the prestigious people be met with special treatment by law who have
committed crime unknowingly?
Arguments
I. Yes, because the prestigious people do not commit crime intentionally.
II. No, it is our policy that everybody is equal before the law.
Solution
Login to view the detailed solution.
Statement : Should mutual funds be brought under stricter Government control ? Arguments :
I. Yes, that is one of the ways to protect the interest of the investors.
II. No. Stricter Government controls are likey to be counterproductive.
‘@AB’ means ‘A is not greater than B’.
‘AB@’ means ‘A is not smaller than B’
‘AB$’ means ‘A is neither greater than nor smaller than B’
‘*AB’ means ‘A is neither greater than nor equal to B’
‘AB*’ means ‘A is neither smaller than nor equal to B’
Now, in each of the following questions, ×nd out which of the two Conclusions i & II is/are de×nitely true?
Give answer a: if only Conclusion I is true
Give answer b: if only Conclusion II is true
Give answer c: if either Conclusion I or II is true
Give answer d: if neither Conclusion I nor II is true
Give answer e: if both Conclusions I & II are true
Statements : *LU, UG*, GS@
Conclusions :
I. LS*
II. *GL
Solution
Login to view the detailed solution.
Statements : @AU, UL$, JL*
Conclusions :
I. JA*
II. JU*
Solution
Login to view the detailed solution.
Statements : @CS, *SD, DM*
Conclusions :
I. DC*
II. SM*
Solution
Login to view the detailed solution.
Statements : *YG, GH@, HR$
Conclusions :
I. RG$
II. *RG
Solution
Login to view the detailed solution.
Statements : PQ$, DP*, SD$
Conclusions :
I. SP$
II. SP*
Solution
Login to view the detailed solution.
In each question below is given a statement followed by two courses of action numbered I and II. A course of action is a step or administrative decision to be taken for improvement, follow-up or further action in regard to the problem, policy, etc. On the basis of the information given in the statement, you have to assume everything in the statement. to be true, then decide which of the suggested courses of action logically follow (s) for pursuing.
Give answer a: if only I follows.
Give answer b: if only II follows.
Give answer c: if either I or II follows.
Give answer d: if neither I nor II follows.
Give answer e: if both I and II follow.
Statement : The cinema halls are incurring heavy loss these days as people prefer to watch movies in home on TV than to visit cinema halls. Courses of action
I. The cinema halls should be demolished and residential multistorey buildings should be constructed there.
II. The cinema halls should be converted into shopping malls.
Solution
Login to view the detailed solution.
Statement : It is necessary to adopt suitable measure to prevent repetition of bad debts by learning from the past experiences of mounting non-performing assets of banks.
Courses of action :
I. Before granting loan to customers their eligibility for loan should be evaluated strictly.
II. To ensure the payment of installments of loan, the work. for which loan was granted. should be supervised minutely on regular basis.
Solution
Login to view the detailed solution.
Statement : Many private sector banks have reduced interest rate on housing loans in comparison to public sector banks.
Courses of action
I. The case should be raised before the regulatory authority for investigation by the public sector banks as they cannot follow such reduction.
II. Public sector banks must adopt such policy to remain in competition.
Solution
Login to view the detailed solution.
Statement : In order to maintains its dignity every nation should prosper economically and ensure development. Courses of action
I. The banks and financial institution must make people aware about the importance of economic growth and development in every country.
II. People should be encouraged to lead life with dignity.
Solution
Login to view the detailed solution.
Statement : Many private sector banks have reduced interest rate on housing loans in comparison to public sector banks.
Courses of action
I. Public sector banks should explore the new avenues in financial sector and should try to establish their monopoly on these avenues and they should provide maximum possible and unique benefit to the customers.
II. The public sector banks should advertise their special feature repeatedly so that they do not lose their future customers.
Solution
Login to view the detailed solution.
Below are given two passages followed by several possible inferences which can be drawn from the facts stated in the passages. You have to examine each inference separately in the context of the passage and decide upon its degree of truth or falsity.
Mark answer (1) if inference is “definitely true”, i.e., it properly follows from the statement of facts given.
Mark answer (2) if the inference is “probably true” though not “definitely true” in the light of the facts given.
Mark answer (3) if the “Data are inadequate”, i.e., from the facts given you cannot say whether the inference is likely to be true or false.
Mark answer (4) if the inference is “probably false” though not “definitely false” in the light of the facts given.
Mark answer (5) if the inference is “definitely false”, i.e., it cannot possibly be drawn from the facts given
or it contradicts the given facts. PASSAGE I
Logically these are rules of conduct. Every country has laid down comprehensive series of practical rules for citizens for resolving mutual contradictory rights and interests. Most of these rules have been laid down to sustain social activities. For instance, many countries have laid down rules to protest against such unsocial activities as theft, attack and murder. These rules are backed by judicial system and executionary institutions, which look after the people who obey the rules and also who violate the rules. Wherever the human behaviour is involved such rules are not only for namesake there but are necessary also.
There is no need to have any machinery to ensure strict adherence to the rules by citizens.
Solution
Login to view the detailed solution.
There is no need of any rules if individuals do not have to interact with each other.
Solution
Login to view the detailed solution.
Human beings are susceptible to violate rules.
Solution
Login to view the detailed solution.
Without rules, human behaviour degenerates into anarchy.
Solution
Login to view the detailed solution.
There are no rules in countries where citizens' interests and rights do not contradict.
Solution
Login to view the detailed solution.
Below are given two passages followed by several possible inferences which can be drawn from the facts stated in the passages. You have to examine each inference separately in the context of the passage and decide upon its degree of truth or falsity.
Mark answer (1) if inference is “definitely true”, i.e., it properly follows from the statement of facts given.
Mark answer (2) if the inference is“probably true” though not “definitely true” in the light of the facts given.
Mark answer (3) if the “Data are inadequate”, i.e., from the facts given you cannot say whether the inference is likely to be true or false.
Mark answer (4) if the inference is “probably false” though not “definitely false” in the light of the facts given.
Mark answer (5) if the inference is “definitely false”, i.e., it cannot possibly be drawn from the facts given or it contradicts the given facts.
PASSAGE II
In the initial years, trade policy in our country was primarily aimed at regulating imports having regard to the nascent stage of country’s development and the need to encourage domestic production through import substitution measures. However, with the onset of liberalisation the importance of globalisation through trade and making exports the engine of growth of economy has been recognised. Export promotion is now a continuous and sustained effort and specific steps in this direction have been taken and achievements have been made in recent years.
Achievements made in the economic growth are attributable to maximum possible export and minimum or almost negligible import.
Solution
Login to view the detailed solution.
At present, there are no regulatory clutches on the export as export is recognised as the main force behind economic growth.
Solution
Login to view the detailed solution.
It is not appropriate to give the credit of economic growth to export.
Solution
Login to view the detailed solution.
Before the implementation of the idea of liberalisation, our trade policy was not much in favour of free import-export.
Solution
Login to view the detailed solution.
Import used to affect domestic production in earlier years.
Solution
Login to view the detailed solution.
Study the following information and answer these questions :
(A) P, Q, R, S, T, U and V are sitting in a circle facing the centre.
(B) S who is second to the right of R is not to the immediate right of V.
(C) U is not between V and T.
(D) P is between R and Q.
Which of the following is wrong ?
(i) T is to the immediate left of R
(ii) Q is to the immediate left of U.
(iii) U, S and T are in a sequence, one after the other.
Which of the following are the two pairs of adjacent members?
What is the position of T ?
Which of the following is correct ?
(i) V is third to the left of R.
(ii) U is between S and V.
(iii) Q is to the immediate left of P
If Q and R interchange places so as T and V, then
Study the following information and answer these questions :
A, B, C, D, E, F and G are students of a class. Each of them has different favourite subject, viz., History, Mathematics, Geography, Civics, English, Sanskrit and Marathi but not necessarily in the same order. There are two such students whose one brother each is there in the group. There is no other relations among the students. No girl likes Mathematics and Sanskrit. D, who does not like Civics and English, is the sister of that student who does like Marathi. The student who likes Civics is the brother of that girl student who does like History. F is a girl student. B is brother of A.
Which of the following is a pair of Brother-Sister other than A and B ?
Solution
Login to view the detailed solution.
Which of the following is true?
Solution
Login to view the detailed solution.
Who does like Sanskrit ?
Solution
Login to view the detailed solution.
How many boys are there in the group ?
Solution
Login to view the detailed solution.
Which of the following combinations of student-subject is correct ?
Solution
Login to view the detailed solution.

