Sign in
Please select an account to continue using cracku.in
↓ →
Join Our IPMAT Preparation Group
Prep with like-minded aspirants; Get access to free daily tests and study material.
The following graph shows Gross Traffic Receipts and Total Expenditure (in ₹) from 2015 to 2019 .
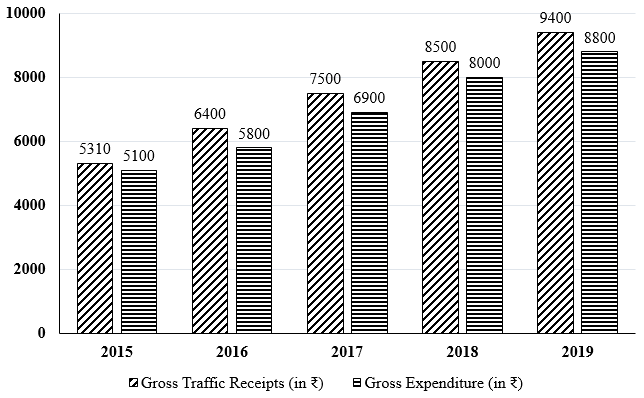
In order to make a profit of 10%, what should have been the approximate gross traffic receipts in 2016, total expenditure remaining the same ?
According to question,
Expenditure in 2016 = ₹5800
Also, required profit = 10%
Now, Receipts should be = Expenditure + 10% profit
=5800 + 10% of receipts
Let, required receipts be x
So, $$x=5800+\dfrac{10}{100}\times\ x$$
or, $$x=5800+0.1\ x$$
or, $$x-0.1x=5800$$
or, $$0.9x=5800$$
or, $$x=\dfrac{5800}{0.9}=6444.44$$
So, total expenditure = ₹6444


Crack IPMAT 2026 with Cracku

Educational materials for IPMAT and IIMB UG preparation

Ask our AI anything

AI can make mistakes. Please verify important information.
AI can make mistakes. Please verify important information.