What is the number of countries in IMF?
SBI PO 2000
For the following questions answer them individually
Who among the following has been honoured with the 1999 "Dadasaheb Phalke" Award?
Recently in which State the resident doctors were declared "war of millenium against government" because they were on a long strike for fourteen days?
On which day the "The World Handicapped Day" is observed on ?
Recently which airline ,Air India has signed an agreement for joint enterprise?
Who among the following has been selected as the ‘’Businessman of the year ‘’ 1999 by the Business India?
Who among the following has been sworn in as Governor of Manipur?
Which of the following publication has recently celebrated its seventy fifth year of Publications ?
The Plane of Indian Airlines which was hijacked recently which is of following is the original route?
Who was among the following is author of the book ‘’The Wealth and poverty Of nations’’.
Recently ,which Gulf Country has passed a bill in the parliament ,according to that bill ladies will be able to use her franchise and get will not able to contest in parliament elections?
The loan which was taken by the indian government directly from market till june 1999, which among the following denotes in percentage of GDF?
Which among the following shows realflow of the foreign investment in india till june 1999?
How much amount has been reserved for the different subsidiaries in union Budget 1999-2000 ?
which of the following is not the reason for the increase in the fiscal deficit of india which is recently estimated?
The 54th summit of the commonwealth countries was recently held at
which of the following countries has launched its experimental space shuttle ‘’shanho ‘’ in November 1999?
Which of the following reasons was reported in newspapers during October -November 1999 that ‘Life of Orissa came to a halt’’.
1. Due to non passing of Budget the state government was unable to do its normal business
2. More than a million staffs of union and state Government banks ,Railway sectors and other govt employees went on strike
3. There come a national calamity in which many lives and enormous property property was loot
which of among of the following Statements is True about the Alien Goslasis which is a child of cuban origin and present living in america
1. The child was saved by the saved by the fisherman when he was swimming
2. He is the only surviving child of three of a boat accident in which mother and father and mother has died.
3. The accident occured when his mother was trying to leave Cuba with her American husband
4. The child wants to go cuba to father's house but America is not allowing so ,because both are not friendly countries
Recently why was Fernando De Laura was in the news?
Which of the following is the perfect source of protein
who among the following the is the recipient of the ‘’1999 Gandhi Peace Prize’’
Falun Gong is related to which of the following countries?
Who among the following author of the book "Dooms Days’’?
Grozny which was in news recently is the capital city of ?
which of the following Value in crore in shows the Exports of software during the period of the between April -September?
Joraba Tribe in which state ?
At which place The Olympic Theater is situated which was in news recently?
which of the following is not true about Italy PM’s visit to libiya?
Recently which among the following has been declared World heritage site by UNESCO?
Who among the following was the CM of Orissa just before Mr Hemchandra Biswas?
Which of the following book has been awarded Nobel prize 1999?
Which of the following anti -disease vaccines which is given to children below 15 years of age has been found ineffective after 1 long study
According to recently made provisions for which sector a Development Authority like SEBI has been Proposed?
Mr Darbari seth who died recently was closely associated with which of the following
Recently the Government of which country has allowed the Nurses to distribute anti-pregnancy tablets ‘’Baad ki Subah’’
From which process pure alcohol can be obtained
Which of the following amount of Disinvestment fixed by the Disinvestment Commission for the current fiscal year ?
Recently ,between the following two temas last asia cup Hockey Tournament was played?
Which of the following is NOT TRUE about india Export during period 1999 April?
1). Exports increased Approximately 10 percent during this period
2). Imports decreased 7.5 percent during this period
3). Trade deficit increased by the 6 percent
Which of the following is NOT TRUE about East Timor which was recently in news?
Charles Barkley ,who was recently in news recently is a famous
German Gorongosa who did recently in news is famous for
Which of the following incident took place in the one of neighbouring countries to India?
Who among the of following has been selected as the ‘’Businessman of the century’’ in India?
Recently Nelson mandela was requested to participate in peace talks to end the home war in the country,which is that country
In december 1999,which of the summit held at Seattle,where people reacted Violently
Which of the following has been become youngest golfer to win Australian Open?
Which of the following is TRUE about Japan and North Korea relations
Why Manila was in news recently ?
In the following passage, some of the words have been left out, each of which is indicated by a number. Find the suitable word from the options given against each number and fill up the blanks with appropriate words to make the paragraph meaningful.
Gandhiji once said, “I would say that if the village perishes, India will perish too. India will be (1) more India. Her own mission in the world will get (2). The (3) of the village is possible only when it is no more (4). Industrialisation on a mass scale will (5) lead to passive or active exploitation of the villagers as the problem (6) competition and marketing come in. Therefore, we have to (7) on the village being self contained, manufacturing mainly for use. Provided this character of the village industry is (8) there would be no objection to villagers using even the modern machines and tools that they can make and (9) to use. Only, they (10) not be used as a means of exploitation of others.”
1
2
3
4
5
6
7
8
9
10
In each of these questions, two sentences are given. These two sentences are to be combined into a single sentence without changing their meaning. Three probable starters of the combined sentence are given as (A), (B) and (C). Any one or more of none of them may be correct. Find out the correct starter(S) and accordingly select your answer among the given five answer choices.
It is very cold here. You must carry warm clothes with you.
A. Since you must…
B. As it is very...
C. If it is very…
Madhuri has been consistent in her studies. Her performance in the examination was excellent.
A. Despite being consistent in her studies…
B. Madhuri’s performance in the examination was excellent, because…
C. Since Madhuri was consistent, her performance…
Solution
Login to view the detailed solution.
The quality of the fabric was not impressive. We changed our plan of purchasing.
A. The quality of the fabric being…
B. We changed our…
C. In spite of the unimpressive
Don’t add so much chilli powder to the soup. Consumers are only small children.
A. Because small children do not allow chilli powder …
B. Since, small children do not consume more soup…
C. Adding more chilli powder to soup makes the small children like …
He always delays in taking any action.it makes others suffer a lot
1.His taking action on time makes
2.Others suffer a lot because of
3.On account of his procrastination
In each of these questions, there are three statements given as (A), (B) and (C). Find out which two or three sentences convey the same meaning. If all the three sentences are different, mark (E) as the answer,i.e., ‘None of these’’
Unlike the tribals who are very hard working ,the urban communities cannot withstand the physical strain.
The judge remarked that not all the accused were really guilty
The manager would like you to help him locate the default
Although the strike of transporters continues ,I shall come
Should you need a duplicate license you must submit an a copy of your ration card
For the following questions answer them individually
The musician had soar throat .Despite that permonance at the concert was ------
We spared no effort to win,but the opposite team did better.The result was obviously ------us
There is growing indifference among the villagers ------ of them bothered to extinguish the fire which broke out in the hutments
Ill health canot dampen his spirit .He was found quite ------ at the ceremony
He found the jewellery box empty.All the ornaments ,jewels ,etc. Were -----
Which of the phrases at a:, b:, c: and d: given below the sentence should replace the phrase printed in bold in the sentence to make it grammatically correct ?
Census reports in India have the voice concerned over the declining sex ratio
As a professional economist he had throughput preoccupied with the basic problems of Indian society
It is easy to prove the guilt but not innocent of a person.
Change in the agricultural growth and rural prices are determinations of important change in the poverty
It is only in the 1980s that a new kind of unity appeared among the capitalist powers
Read the fallowing passge and answer the below questiosn
The development of nationalism in the third world countries, as is well known, followed a very different trajectory from that in the advanced capitalist countries. In the latter it was a part of the process of the emergence of the bourgeois order in opposition of feudalism, while in the former it was a part of the anti-colonial struggle. The impact of colonialism, though it differed across countries, had on the whole been in the direction of transcending local ism and unifying supra-local economic structures through the introduction of market relations. The struggle against colonialism, consequently, took the form of a national struggle in each instance in which people belonging to different tribes or linguistic communities participated. And the colonial power in each instance attempted to break this emerging national unity by splitting people. The modus operandi of this splitting was not just through political manipulation as happened for instance in Angola, South Africa and a host of other countries; an important part of this modus operandi was through the nurturing of a historiography that just denied the existence of any overarching national consciousness. The national struggle, the national movement were given a tribal or religious character, they were portrayed as being no more than the movement of the dominant tribe or the dominant religious group for the achievement of narrow sectional ends. But the important point in this colonialism, while, on the one hand, it objectively created the condition for the coming into being of a national consciousness at a supra-tribal, supra-local and supra-religious level, on the other hand it sought deliberately to subvert this very consciousness by using the same forces which it has objectively undermined.
The colonial powers tried to camouflage national movement and to show it as only
From the content of the passage it appears that the author is
Which of the following statements is definitely true in the context of the passage?
Colonialism internally helped awakening nationalism among people of different tribes, religions, etc.
Advanced capitalist countries had nurtured nationalism as an opposition to feudalism.
The national struggle was not successful because the colonial powers succeeded in dividing the people.
What was the motive of colonial powers in writing a distorted history?
How did nationalism originate in the third world countries?
What was the role of introduction of market relations in the process of economic integration?
The author has given the example of Angola, South Africa, etc in order to
How did colonial power react to topple the anti-colonial structure?
Which of the following was the advantage of struggle against colonialism?
Choose the the word which is most OPPOSITE in the meaning of word givein in bold below
SUBVERT
NURTURING
SPLITTING
Choose the word which is has most SIMILAR meaning in given words
Emergence
TRANSCENDING
TRAJECTORY
Following statements have given in different parts like (A),(B),(C),(D), and you need to identify which part of the sentence has the error .if no statement have the error you can give your answer (E)
His continually(A) /defending(B) his stand on the issue has risen (C)/doubts (D)in the mind of jury.
Policy of permitting(A)/legal(B)/import of gold has stimulated(c) /its consumation(D).
The government’s strategy to encourage (A)/entreprenership(B)/gathers momentum (D) with unenvisaged (D)/ response.
The perception(A)/of animal life was even more ambigous(B)/ because of anthropomorphic (C) /characteristics (D)/ of animal behaviours
It is needed recommendable (A)/that the apex court deemed(B)/in necessary to remind the government of its duties to promoting(C)/ education and investing(D).
Read the following table to answer the given questions
Average production of six Machines of the given years in thousands

How many machines has production lower than 700 for all given years?
Solution
Login to view the detailed solution.
Which machines have shown the least fluctuation in production?
Solution
Login to view the detailed solution.
Which of the following can be concluded?
Solution
Login to view the detailed solution.
For which year and the machine has the production highest for the given date?
Solution
Login to view the detailed solution.
For which machine has the less number there been increase in the productin from the previous year?
Solution
Login to view the detailed solution.
Study the following graph carefully and answer the given questions

For assembled PC sale ,which year the percent growth is the highest compared to previous
Solution
Login to view the detailed solution.
In which year the difference in the growth between Branded and Assembled lowest ?
Solution
Login to view the detailed solution.
What is the difference between Total Branded and Total assembled PCs?
Solution
Login to view the detailed solution.
If the Branded PCs sold in 1996 were 1,00,000.how many branded PCs were sold in 1999?
what is the average percentage Growth of sales of Assembled PCs for the given years?
Solution
Login to view the detailed solution.
Study the following graph and answer the following questions
Percentage increase in sale of four commodities A,B,C,D. For the given months.
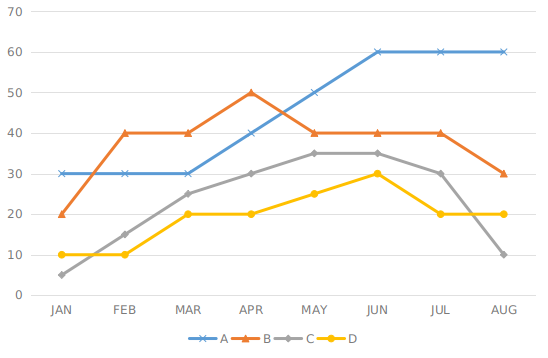
For which commodity is percent increase in sale highest in May from January
Solution
Login to view the detailed solution.
If the sale of C was the 100 in may ,what was its sale in July?
Solution
Login to view the detailed solution.
In which month(S) did all the commodities showed decline or no increase from the previous Months?
Solution
Login to view the detailed solution.
In which month is the average percentage increase for the four commodities the lowest ?
Solution
Login to view the detailed solution.
For which months did A show good increase in?
Solution
Login to view the detailed solution.
For the following questions answer them individually
A train running at speed of 120 kmph crosses a signal in 15 seconds .What is the length of the train in meters?
Solution
Login to view the detailed solution.
An amount of Rs 1,25,000 is to be distributed among the Sudhir,Soni,Shakunthala in the respective ratio of 2 : 3 : 5.What will be the difference between Soni's and Sudhir's Share?
Solution
Login to view the detailed solution.
Two chairs and three tables cost Rs 1025/- and 3 chairs and 2 tables cost is Rs 1,100/- .What is the difference between the cost one table and chair?
Solution
Login to view the detailed solution.
The total marks obtained by Jaya in the maths and Physics together are 50 more than the marks obtained by her in chemistry, if she got 20 marks in the physics .What are her marks in maths?
Solution
Login to view the detailed solution.
Six years ago Jagannath was twice as old as Badri if the ratio of their present age is 9:5 respectively .What is the difference between their present ages?
Solution
Login to view the detailed solution.
A boat takes 2 hours to travel from point A to B in still water .To find out it’s speed up-stream ,which of the following information is needed.
i. Distance between point A and B
Ii.Time taken to travel down stream from B to A
iii. Speed of the stream of the water
iv. Effective speed of Boat while traveling Downstream from B to A
Solution
Login to view the detailed solution.
An article when sold for 960 fetches 20% profit.What would be the percent profit /loss if such 5 article are sold for Rs. 825/-each?
Solution
Login to view the detailed solution.
Study the following graph carefully to answer the given questions?
Human Resources Index of an Organisation for the given years.

In which year is the percent increase the highest from its previous year?
Solution
Login to view the detailed solution.
What is the approximate average for the given Years?
Solution
Login to view the detailed solution.
Which of the following is true?
Solution
Login to view the detailed solution.
The index in 1998 was what percent of that of 1996?
Solution
Login to view the detailed solution.
What is the percent increase from 1993 to 1999?
Solution
Login to view the detailed solution.
Study the following Information carefully and answer the questions given below
Number of students appeared ,passed and granted scholarships over the years

What is the approximate Percentage of total Granted Scholarship to the total appeared?
Solution
Login to view the detailed solution.
What is the approximate percentage of total passed to total appeared ?
Solution
Login to view the detailed solution.
In which year was the percentage passed to appeared the highest?
Solution
Login to view the detailed solution.
In which year is the scholarship Granted to passed Ratio is highest?
Solution
Login to view the detailed solution.
Which of the following seems table most possible reason for substantial increase of number appeared in 1999 ?
Solution
Login to view the detailed solution.
For the following questions answer them individually
What will be come in the place of question mark?
$$0.001+9.909\times1.01\div0.1$$
Solution
Login to view the detailed solution.
When the length of the rectangular plot is increased by four times its perimeter becomes 480 meters and area becomes 12800 sq.m. What is its original length(in meters)?
Solution
Login to view the detailed solution.
What will come in the place of question mark (?) in the following series ?
2 9 28 65 ?
Solution
Login to view the detailed solution.
A group of 20 girls has average age of 12 years. Average of first 12 from the same group is 13 years and what is the average age of other 8 girls in the group?
Solution
Login to view the detailed solution.
The sum of three consecutive number is given .What is difference between first and third number?
Solution
Login to view the detailed solution.
$$(299.99999)^{3}$$ =?
Solution
Login to view the detailed solution.
Find the what approximate value which should be come in place of the following questions .(You are not expected to calculate exact value).
$$\frac{2}{5}+\frac{7}{8}\times\frac{17}{19}\div\frac{6}{5}=?$$
Solution
Login to view the detailed solution.
399.9+ 206 x 11.009=?
Solution
Login to view the detailed solution.
$$(10008.99)^{2}/(10009.001)\times\sqrt{3589}\times0.4987=?$$
Solution
Login to view the detailed solution.
$$\sqrt{45689}=?$$
Solution
Login to view the detailed solution.
In each of the following questions a number series is given.After the series , a number is given followed by a (a),(b),(c),(d) and (e).You are required to complete the series starting with the number given following the sequences of the given series?
2 6 40 1636 2676504
1 (a) (b) (c) (d) (e)
What will come in place of (d) ?
3 7 24 101 512
5 (a) (b) (c) (d) (e)
What will come in place of (c) ?
Solution
Login to view the detailed solution.
3 9 81 6561
2 (a) (b) (c) (d) (e)
What will come in place of (d) ?
Solution
Login to view the detailed solution.
150 299 601 1197 2401 4793
60 (a) ( b) (c) (d) (e)
What will come in place of (e) ?
Solution
Login to view the detailed solution.
12 24 96 576 4608
5 (a) (b) (c) (d) (e)
What will come in place of (c) ?
Solution
Login to view the detailed solution.
For the following questions answer them individually
A number gets reduced to its one third when 48 is subtracted from it.What is two third of that Number?
Solution
Login to view the detailed solution.
What will be the the compound interest acquired on sum of Rs 12,000/- for 3 years at the rate of 10 % per annum ?
Solution
Login to view the detailed solution.
Jayesh is twice as old as Vijay and half as old as Suresh .If sum of Suresh’s and Vijay’s age is 85 years what is the Jayesh’s age in years?
Solution
Login to view the detailed solution.
Read the following information carefully and answer the questions given below:
Following are the conditions for short listing candidates for the post of Marketing officer for Payment bank. The candidate to be called for interview must
(i) be a graduate in Science, i.e. B.Sc, with minimum 55% marks.
(ii) have at least 3 years experience in selling/marketing
(iii) have participated in debating or drama or sports at the intercollegiate level onwards.
(iv) have secured minimum 60% marks in the Written Examination (WE)
(v) be ready to deposit Rs 10,000 as security deposit.
However, in case of a candidate who fulfils all these criteria except
(a) (iv) above, but has secured minimum 60% at B.Sc, may be referred to the Chief Manager
(b) (i) above, but has passed M.Sc, i.e. Post Graduation in Science, with minimum 50% marks, may be referred to DGM
Based on these criteria and information provided below, decide the course of action in each case. You are not to assume anything. If the data provided is not adequate given course of action, your answer will be ‘data inadequate’. All the candidates given below fulfill the criterion for age.
Mark Answer If the decision is as follows
a: Selection for Interview
b: Not to be selected
c: Data inadequate
d: Refer to Chief Manager (C.R)
e: Refer to the DGM(C.R)
Deepika is a 26 years girl having obtained 60% marks in Post-Graduation. I.e M.sc,. 53 % and 64 % in B.sc and W.E . respectively .Deepika has worked as sales executive for three and half years.She has obtained many prizes in intercollegiate events in debating and ready to deposit Rs 10,000 as security deposit.
Chandrakant is a 30 years officer having obtained 67% marks in Post-Graduation in Business management,. 58 % and 55% in B.sc and W.E . respectively .Chandrakant has worked as sales executive for 5 years.He has obtained many prizes in intercollegiate events in debating and ready to deposit Rs 10,000 as security deposit.
Jagannath is science graduate having obtained a P.G in journalism,. 58 % and 55% in B.sc and W.E . respectively .He has worked as sales executive for 4 years.He has obtained many prizes in intercollegiate events in debating and ready to deposit Rs 10,000 as security deposit.
Krupa is successful sports person having won several prizes in sports and obtained many prizes in intercollegiate events in debating. she obtained 62% ,55%,65% in B.sc,M.sc, and W.E respectively .She has 5 years experience in sales.Her father is successful Businessman
Dinkar has won many Prizes in sports in the inter college/university level.He has seven year experience in the direct sales.He has scored 65% ,56% and 53% in marks W.E ,B.sc, and M.sc respectively.He is ready to give security deposit and desires to make a carrer in selling.
Kamal Kanchan has 6 years experience in marketing cosmetic Products.She has done her B.sc and M.sc ,M.B.A with 65%,56%,62% marks respectively .She is ready to pay the security deposit .She is good at debating and has won many prizes in inter college competitions .She is interested in social work
Rohan is son of a marketing executive .Rohan has obtained many prizes in intercollege events.He has worked as marketing executive for 5 years after completing his B.sc and M.B.A with 62%,70% respectively.He is ready to deposit security amount of Rs 10000/-.He has obtained the 65% marks in W.E.
Following are based on the English alphabets.
A B C D E F G H I J K L M N O P Q R S T U V W X Y Z.
How many pair of letters are there in the word NURSING which have as many as letters between them in the Alphabet?
Solution
Login to view the detailed solution.
In certain code ‘PENCIL’ is written as ‘RCTAMJ’ ,then what is the code for ‘BROKEN’ in that Language?
Solution
Login to view the detailed solution.
What will come in the question mark in the following series?
DGK GKP ? PVC
Solution
Login to view the detailed solution.
If first 6 letters shall be written in opposite order,then next 6 letters shall be written in opposite direction.At the end Y will be interchanged by Z then which will be the fourth letter to the left of 13th letter from right?
Solution
Login to view the detailed solution.
If the letters from T to Z are interchanged in opposite direction by the letter A to G in such way that A takes the positions of T and so on ,then which will be the third letter to the right of 18th letter from left?
Solution
Login to view the detailed solution.
Read the following information and answer the given questions.Symbolise the given number and symbol.
Number 1 2 3 4 5 6 7 8 9
Symbol x * ? & $ % + ! £
Conditions:
I. if any number begins by the odd number then the odd number symbolised by @
II. if any number ends by even number then the even number symbolised as ©
Which of the following will be the symbol of 25486 ?
Solution
Login to view the detailed solution.
Which of the following will be the symbol of 178524?
Solution
Login to view the detailed solution.
which of the following is symbol of 846721?
Solution
Login to view the detailed solution.
Which of the following is the symbol of 236475?
Solution
Login to view the detailed solution.
Which of the following is symbol of 673258?
Solution
Login to view the detailed solution.
In each of the questions below consists of a question and two statements numbered I and II given below it. You have to decide whether the data provided in the statements are sufficient to answer the question. Read both the statements and
Give answer
(A) If the data in statement I alone are sufficient to answer the question, while the data in statement II alone are not sufficient to answer the question
(B) If the data in statement II alone are sufficient to answer the question, while the data in statement I alone are not sufficient to answer the question
(C) If the data either in statement I alone or in statement II alone are sufficient to answer the question
(D) If the data given in both statements I and II together are not sufficient to answer the question
(E) If the data in both statements I and II together are necessary to answer the question.
Which word in the code language ‘flower’ means?
I. ‘de fu la pane’ means ‘rose flower is beautiful’ and ‘la quiz’ means ‘beautiful tree’.
II. ‘de la chin’ means ‘red rose flower’ and ‘pa chin’ means ‘red tea’.
Solution
Login to view the detailed solution.
How is P is related to the Q?
I. J has the two daughters ,one of them R is married to P.
II. Q is the mother of S, who is the younger sister of R.
Solution
Login to view the detailed solution.
Among P,Q,R,S and T, who ranks third in the terms of salary obtained by them?
I. T’s salary is more than P and Q but not more than S.
II. R’s salary is lowest among them.
Solution
Login to view the detailed solution.
Can Rohan retire from office X in the April 2000, with full pension benefits?
I. Rohan will completes 30 years of service in office X in April 2000 and desires to retire.
II. As per office X rules an employee has to complete 30 years of service and attain age of 60 years. Rohan was 3 years to complete age of 60 years.
Solution
Login to view the detailed solution.
Which village is to the North-East of village ‘A’.?
I. Village B is to the North of village A, villages C and D are to the East and West of the of the village B respectively.
II. Village P is to the South of Village A and village E is to the East of the village P. village K is to the North of village P.
Solution
Login to view the detailed solution.
Read the following information and answer the following questions.
Seven friends P,Q,R,S,T,U and W have gathered at the mumbai Airport .Five of them are scheduling five different places like Delhi,Chennai,Lucknow,Bangalore ,and Calcutta.
Five of them are executives ,each of them are specializing are in the viz Admin,Marketing,System, HR,Finance.
T, an executive is going to Chennai and is neither from finance nor from Marketing
W is a system specialist and is leaving for Delhi.U is an executive and is not going to one of the five states
Q is an executive from HRM but has come back at the airport to see his friends?
P is an executive but not from Marketing and is flying to one of the destinations but not to Bangalore or Calcutta.
Who is going to fly the Bangalore?
Solution
Login to view the detailed solution.
R has specialization in which of the following fileds?
Solution
Login to view the detailed solution.
Who among the following specializes in the marketing ?
Solution
Login to view the detailed solution.
The one who is going to fly to Chennai is ?
Solution
Login to view the detailed solution.
Read the following information and answer the questions based on it.
The length ,breadth and height of a rectangular piece of wood in the 4cm,3cm, 5cm respectively
Opposite side of 5cm x 4 cm pieces are coloured in red colour
Oppsite sides 4cm x 3 cm ,are cloured in blue
Rest 5 cm x 3 cm are coloured in green in both sides
Now the piece is cut in such way that a cuboid of 1cm x 1cm x 1cm will be made
How many cuboids shall have only one colour ?
Solution
Login to view the detailed solution.
How many cuboids shall have only two colours red and green in their two sides?
Solution
Login to view the detailed solution.
How many cuboids shall not any colour?
Solution
Login to view the detailed solution.
How many cuboids shall have all the three colours?
Solution
Login to view the detailed solution.
In each of following questions have the respective statements and related conclusions .you have to take given statement is as correct and answer the following questions
statements
All chillies are garlics
Some garlics are onions
All onion are potatoes
No potato is ginger
Conclusions:
No onion is ginger
Some garlic are potatoes
Some chillies are potatoes
Statements:
Some films are clouds
All rats are cloud
Some clouds are chains
Conclusions:
No film is chair
Some rats are films
Some clouds are rats
Some chairs are rats
statements:
Some keys are locks
Some locks are numbers
All numbers are letters
All letters are words
Conclusions:
Some locks are letters
Some words are numbers
All numbers are words
statements
Some windows are doors
All doors are walls
No wall is a roof
All roofs are shelters
Conclusions:
Some windows are walls
No wall shelter
No door is shelter
Statements:
Some gates are flowers
Some gates are fruits
Some flowers are clips
Conclusions:
Some flowers are gate
Some clips are fruits
Some clips are gates
No any flower is fruit
Study the following information carefully to answer the questions given below. In a toy exhibition, a machine processes a given input by the following rule. Participants are shown one by one till it reaches its last step. Following is an illustration of the working of this machine.
Input : sui me ato fe zen u no
Step I : fe sui me no ato zen u
Step II : no fe sui u me ato zen
Step III: u no fe zen sui me ato
Step IV: zen u no ato fe sui me
Step V : ato zen u me no fe sui
Which of the following steps would read as ‘not you only say wise yet are’ for the input ‘say not you are only wise yet’?
Solution
Login to view the detailed solution.
If the Step V of an input is ‘so cd rom lay is nor it’, which of the following would be its Step II ?
Solution
Login to view the detailed solution.
If the Step III of an input is ‘lo men chi from yet as know’, which of the following would be its input?
Solution
Login to view the detailed solution.
Which of the following correctly describes the ‘machine logic’ in generating various steps based on the given input?
Solution
Login to view the detailed solution.
What will be the step IV for the following input?
Input: may sen to cry if not hell
Solution
Login to view the detailed solution.
Read the following informations and answer the given questions.
1.‘P$Q’ means ‘P is either greater than or equal to Q’
2.‘P@Q’ means ‘P is neither equal to nor smaller than Q’
3.‘P© Q’ means ‘P is neither smaller than nor greater than Q’
4.‘P£Q means P is not greater than Q
5.‘P?Q’ means ‘P is neither greater than nor equal Q
R©U,U?Q,W$R
Conclusion : I. W©U, II. W@U
Solution
Login to view the detailed solution.
L@T,P?T,K$L
Conclusion : I. L@P, II. K@T
Solution
Login to view the detailed solution.
Z@D,F© D,F$G
Conclusion : I. D©G, II. Z@G
Solution
Login to view the detailed solution.
J©P, P$N ,J£H
Conclusion : I. J©N, II. H@P
Solution
Login to view the detailed solution.
N?S,S@P ,P£M.
Conclusion : I. S@M, II. P©N
Solution
Login to view the detailed solution.
In each question below is given a statement followed by two assumptions numbered I and II. You have to consider the statement and the following assumptions and decide which of the assumptions is implicit in the statement.
Give answer
a: If only assumption I is implicit
b: If only assumption II is implicit
c: If either I or II is implicit
d: If neither I nor II is implicit
e: If both I and II are implicit.
Statement: "You are hereby appointed as a programmer with a probation period of one year and your performance will be reviewed at the end of the period for confirmation." - A line in an appointment letter.
Assumptions:
I.The performance of an individual generally is not known at the time of appointment offer.
II.Generally an individual tries to prove his worth in the probation period.
Statement: It is desirable to put the child in school at the age of 5 or so.
Assumptions:
At that age the child reaches appropriate level of development and is ready to learn.
The schools do not admit children after six years of age.
Statement: Unemployment allowance should be given to all unemployed Indian youth above 18 years of age.
Assumptions:
There are unemployed youth in India who needs monetary support.
The government has sufficient funds to provide allowance to all unemployed youth.
Statement: "In order to bring punctuality in our office, we must provide conveyance allowance to our employees." - In charge of a company tells Personnel Manager.
Assumptions:
Conveyance allowance will not help in bringing punctuality.
Discipline and reward should always go hand in hand.
Statement: "If you trouble me, I will slap you." - A mother warns her child.
Assumptions:
With the warning, the child may stop troubling her.
All children are basically naughty.

