")
In the CAT exam, questions related to pie charts frequently appear in the Data Interpretation and Logical Reasoning (LRDI) section. Thus, it is crucial for CAT aspirants to be well-versed in interpreting and solving pie chart-related problems to secure a higher score. To aid in this preparation process, we are offering Set-2 of Pie Chart Questions for CAT in PDF format, which can be downloaded and practised to improve one’s proficiency in this area. In this article, we will provide you with the most important Pie chart questions to prepare for the CAT exam.
Pie Chart Questions for CAT (Set – 2)
CAT Data Interpretation Questions PDF
Download CAT Quant Questions PDF
Take Free Mock Tests for CAT 2023
Instructions: On the basis of the information given below, answer the questions that follow.
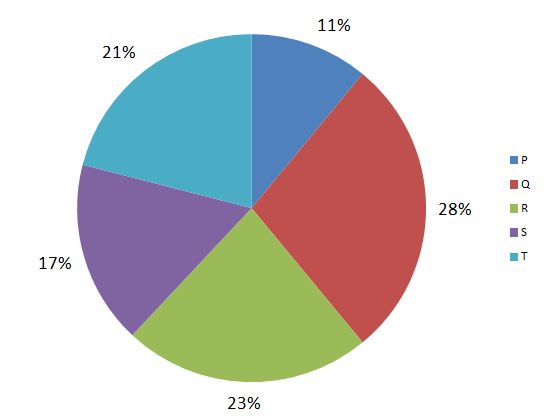
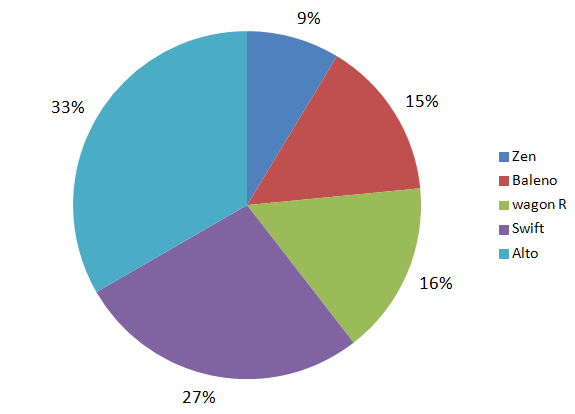
Maruti Suzuki has tie-ups with five dealers in Allahabad to sell their cars. The first pie chart given below gives the dealer-wise break-up of the number of cars sold by Maruti Suzuki in Allahabad in 2015. The second pie chart shows the model-wise breakup of the total cars sold by Maruti Suzuki in 2015 in Allahabad.
Question 1: If the dealer T sold an equal number of all five models of Maruti Suzuki then what is the maximum share(in %) that T can have in total sales of any model?(Enter only the integer value rounded off to nearest integer. Don’t put % sign)
a) 27
b) 57
c) 17
d) 47
Question 2: If the dealers R and S sold only Zen, Baleno and swift then at least what percentage of the Swifts sold, were sold by these two dealers alone? (Enter only the integer value rounded off to nearest integer. Don’t put % sign)
a) 63
b) 59
c) 84
d) 33
Question 3: If for any dealer, the percentage of Wagon R’s sold by him did not exceed 25% of his total sales, then at least how many dealers sold Wagon R?
a) 3
b) 8
c) 11
d) 17
Download CAT 2023 Syllabus PDF
Question 4: At least how many models of Maruti Suzuki did dealer Q sell given that for any model that Q sold, Q’s share(in %) was at most one-third of the total cars sold for that model.
a) 22
b) 64
c) 4
d) 46
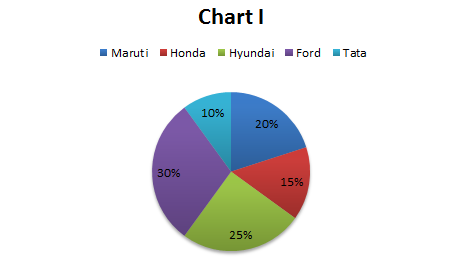
Instructions: The pie chart shown below gives the percentage distribution of car sales (in
numbers) between five companies – Maruti, Honda, Hyundai, Ford and Tata during the year 2014 – 2015. The total number of cars sold by the five companies together in 2014-2015 is four hundred thousand.
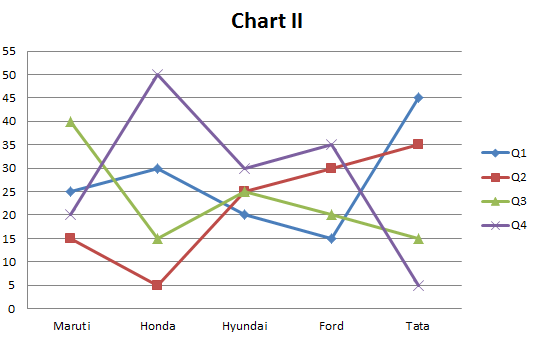
The line graph shown below gives the percentage distribution of the number of cars sold by each of the five companies in the four different Quarters of the year.
Question 5: Which company sold the highest number of cars in the second quarter ?
a) Maruti
b) Honda
c) Hyundai
d) Ford
Question 6: What is the ratio of the number of cars sold by Ford in the third quarter and the number of cars sold by Honda in the first quarter ?
a) 1:2
b) 4:3
c) 4:5
d) 1:3
Question 7: In how many quarters were the number of cars sold by any two companies in that quarter the same?
a) 0
b) 1
c) 2
d) 3
Question 8: In how many instances there was a decrease in the number of cars sold in a
particular quarter by any company as compared to the previous quarter?
Note: If Maruti sold less number of cars in Q2 compared to Q1, then it is counted as 1 instance
a) 5
b) 6
c) 7
d) 8
Solutions for Pie Chart Questions for CAT:
Solutions:
1) Answer (D)
If dealer T sold an equal number of each model, then for each model his share would be 4.2%. Hence his share would be maximum for the model which had least share among the total sales. The least share is for Zen which is 9%
Hence, the maximum share that T can have for any model = $$\frac{4.2}{9}*100$$ = 46.67% which on rounding off becomes 47%.
Hence the required integral value to be entered is 47.
2) Answer (B)
If the number of swifts sold by R and S is to be minimum, R and S should sell a maximum number of Baleno and Zen. The share of R and S in total sales is 40%. So even if they sell all Baleno’s and Zen that will account to only 24%, so they together will sell 16% Swifts. The total share of swifts is 27% so they sold 16%. Hence percentage share would be $$\frac{16}{27}*100$$ = 59.25% which on rounding off becomes 59%. So correct answer is 59.
3) Answer (A)
We have to minimize the number of dealers who sold Wagon R.
So to minimize the number of dealers, the dealers who have largest share in total sales should have maximum share of Wagon R. So if we assume that Q and R sold Wagon R the maximum number of Wagon R’s they can sell is 25% of 51 which is equal to 12.75%. But the overall share of Wagon R is 16% so there should be at least 1 more dealer who sells Wagon R. Hence the correct answer is 3.
Download Quantitative Ability for CAT
4) Answer (C)
We have to find that at least how many models of car were sold by Q. We know that Q sold at most one-third for any model. Q’s total share is 28%. To minimize the number of models, the share of Q should be maximum for the models which had highest sales percentage. The maximum share that Q can have in any model is 33.33%. So if Q had 33.33% share in Alto and Swift, then that will account to 33.33% of 60 = 20%. Even if we include Wagon R, the share would be 33.33% of 76 = 25.33. Now if include any one from the remaining two models the share can reach 28%. So Q sold at least 4 different models.
Solutions (5 – 8):
The data given in the pie chart and the line chart can be tabulated into the following table (Data is in 000’s) :
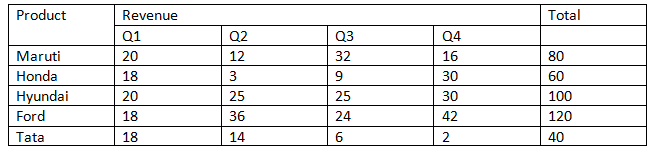
5) Answer (D)
From the table, we can see that Ford sold the highest number of cars in the second quarter.
6) Answer (B)
From the table, the no. of cars sold by ford in the third quarter to no. of cars sold by Honda in the first quarter = 24:18 = 4:3
7) Answer (C)
We can see that in Q1 and Q4 there are companies which sold equal number of cars. Thus, C is the right choice.
8) Answer (C)
From the table, we can see that there are seven instances where the number of cars sold by a company in a quarter is less compared to the previous quarter.


