SSC GD Quant Test 3
Instructions
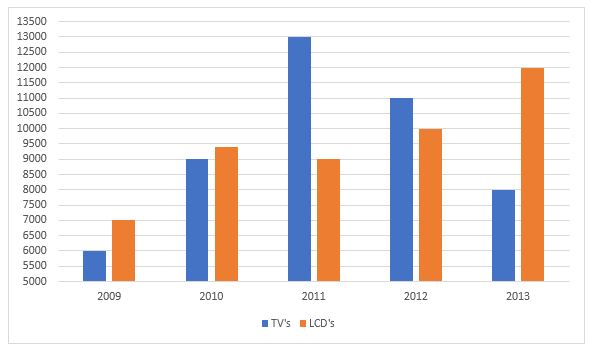
Study the following bar diagram carefully and answer the following questions.
The number of the production of electronic items (TVs and LCDs) in a factory during the period from 2009 to 2013.
Q 1
The ratio of production of LCDs in the year 2011 and 2013 is
Q 2
The difference between averages of production of TVs and LCDs from 2009 to 2012 is
Q 3
The ratio of production of TVs in the years 2009 and 2010 is
Q 4
The total number of products of electronic items is maximum in the year
Instructions
For the following questions answer them individually
Q 5
Find the value of $$\frac{4+3\sqrt{3}}{7+4\sqrt{3}}$$ is
Leaderboard
| # | Name | Overall Score |
|---|---|---|
| 1 | divya gupta | 5 |
| 2 | Kamal Prasad | 5 |
| 3 | Manika Soorma | 5 |
| 4 | Sneha Varun Gupta | 5 |
| 5 | pratyusha rao | 5 |
| 6 | Bala Tarun | 5 |
| 7 | Sunil Kumar | 5 |
| 8 | Anand Gupta | 5 |
| 9 | Omkar Dashetwar | 5 |
| 10 | Pradeep Jha | 5 |