SSC CGL Mathematics Test 10
The pie chart shows the annual car production (in millions) of six countries (A, B, C. D, E, F). Study the diagram and answer the following questions.
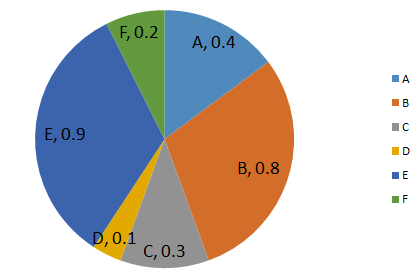
Which country produced the second least number of cars?
Country E produced how many more cars (in %) than country B?
If 35% of the cars produced by these six countries are diesel and the rest are petrol, then how many petrol cars were produced (in millions)?
If on an average the cost price of a car is 30000 USD and environmental tax levied on each car is 2.5% of its cost price, how much environmental tax was collected (in billion USD) from production of cars in these 6 countries?
For the following questions answer them individually
The midpoints of AB and AC of a triangle ABC are X and Y respectively. If BC+XY=12 units, then BC-XY is
Leaderboard
| # | Name | Overall Score |
|---|---|---|
| 1 | Prince Rajput | 5 |
| 2 | Priyanka | 5 |
| 3 | Stephen | 5 |
| 4 | vikram | 5 |
| 5 | Sachin Mehta | 5 |
| 6 | Prasoon Pandey | 5 |
| 7 | shambhu | 5 |
| 8 | Priyanka Dasari | 5 |
| 9 | nesan siva | 5 |
| 10 | sagar sharshwat | 5 |