
Data Interpretation Questions for Railways Group-D and RRB ALP:
Practice Data Interpretation questions and answers with detailed explanations for Railway exams of RRB Assistant loco pilot (ALP) & Technician and Railway group-D. Download DI Questions for RRB Exams with solutions
Data Interpretation Questions for Railways Group-D and RRB ALP
Railway Important Question and Answers PDF
Get 40 Railway mocks for just Rs. 249
Instructions:
The following table shows the sectoral distribution of production of Fabrics in India
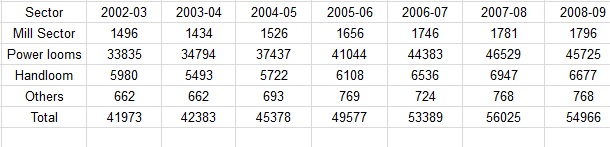
Question 1:
What is the code for ‘drill’?
a) uw
b) bi
c) tx
d) hp
Question 2:
What is the percentage increase (approximate) in the output by Mill sector in the year 2007-08 when compared to the previous year ?
a) 0.2
b) 3.0
c) 2.0
d) 2.4
Question 3:
Read the statement below and answer the question that follow:
Statement I:The contribution of mill sector to the total production of Fabrics in India does not exceed 4%.
Statement II.The ratio of the production by mill sector to that of Handloom sector in 2004-05 and 2006-07 are almost same.
a) Only statement I is true
b) Only statement II is true
c) Both the statement I and II are true
d) Both the statement I and II are false
Question 4:
If the same % decrease in the production of fabrics in 2008-09 continues the next year also what is the production in 2009-10 ?
a) 53972
b) 53927
c) 53792
d) 53279
Railway Group-D online Mock Test
Solutions: (1 to 4)
1) Answer (b)
The approximate percentage of Handloom in the total = 6108 / 49577 = 12.3%
2) Answer (c)
approximate % increase in output of Mill sector in 2007-08 compared to previous year=
1781-1746/1746*100%=2%
3) Answer (c)
percentage of mill sector to that of fabrics from 2002-03 to 2008-09 is given below:
3.56, 3.38 ,3.36, 3.32, 3.27, 3.17, 3.26
thus, in no year the % is greater than 4.∴ statement 1 is correct.
The ratio of mill sector to handloom in 2004-05 and 2005-06 are 26.67% and 27.1% respectively.∴ Statement 2 is also correct.Thus, option C is the right choice.
Hence, option C is the correct choice.
4) Answer (b)
percentage loss in 2008-09=(56025-54966)/56025 ×100=1.89%
the percentage loss in 2009-10 is 1.89%
=> the fabric production in 2009-10=98.11% of 54966=53927.68≅= 53927
Crack Government Exams the smarter way with “Cracku”
Cracku Wishes You All the Best for the upcoming RRB- ALP and Group D, SSC, NABARD Grade-A Assistant Manager, RBI Grade B and other Competitive exams.


[…] Data Interpretation […]